In this edition of The Edge we revisit a topic previously discussed elsewhere – the relationship between inflation and the bond-equity correlation.1 Building on the results from previous blogs2, we develop our study to an untried, yet related question: is there a relationship between the correlation of headline and core inflation, and the correlation of bonds and equities?
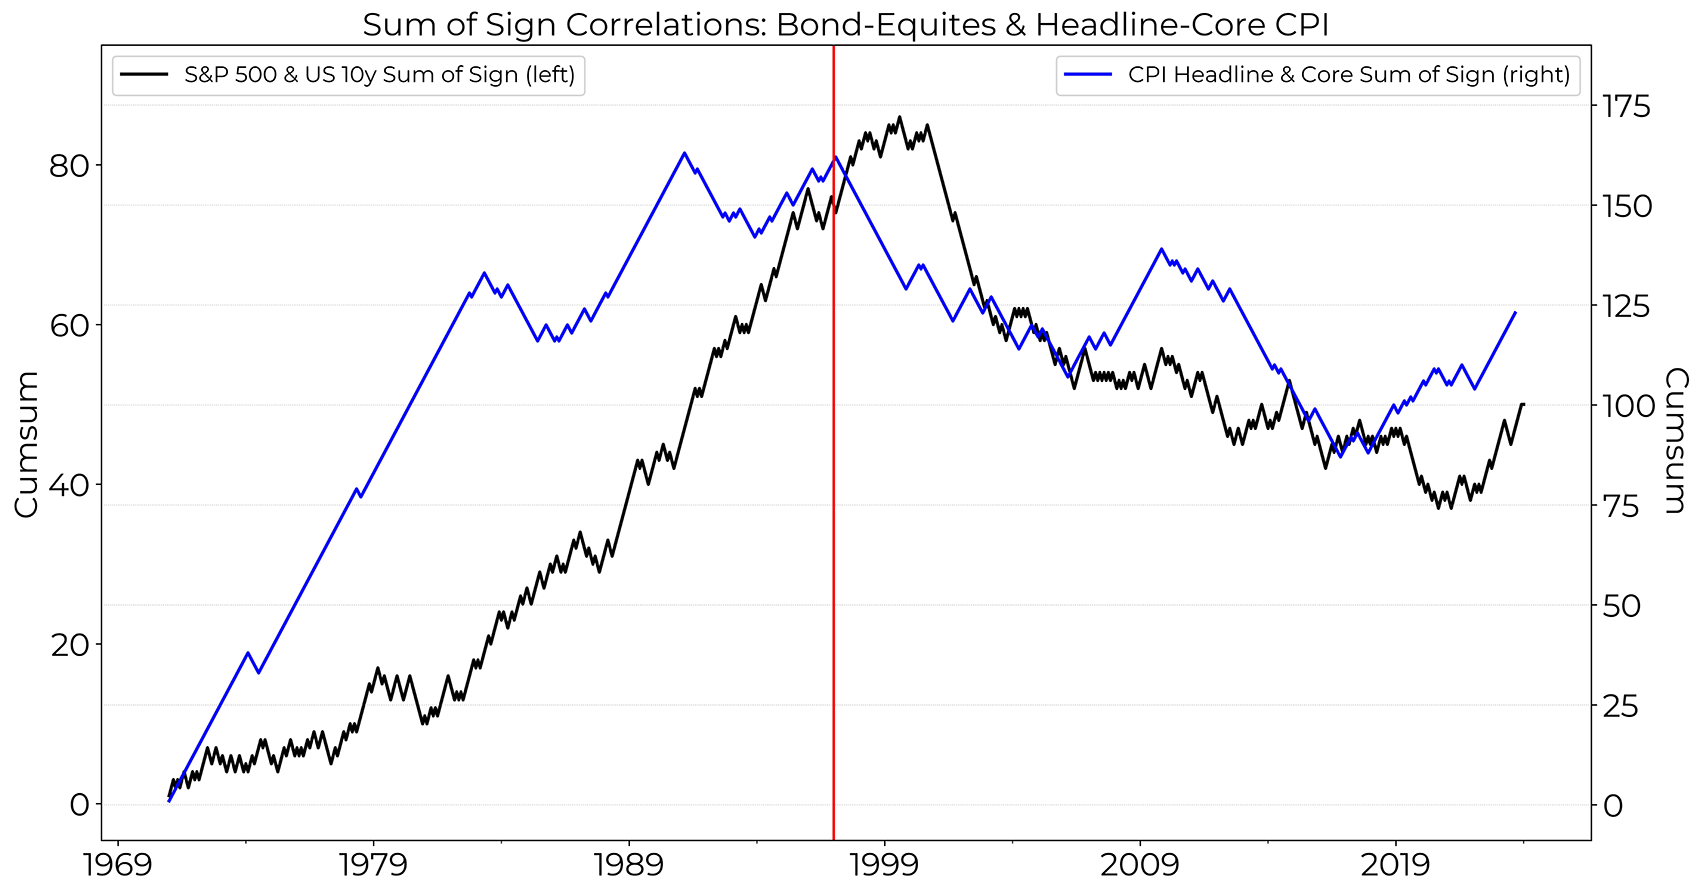
To test this, yet also remaining consistent with the application of our alternative measure of correlation (a handy reminder can be found in the endnotes3), we calculate the correlation P&L of headline and core inflation (headline minus the food and energy components) and compare with the correlation P&L of bonds and equites. The result is presented in figure 1 below.
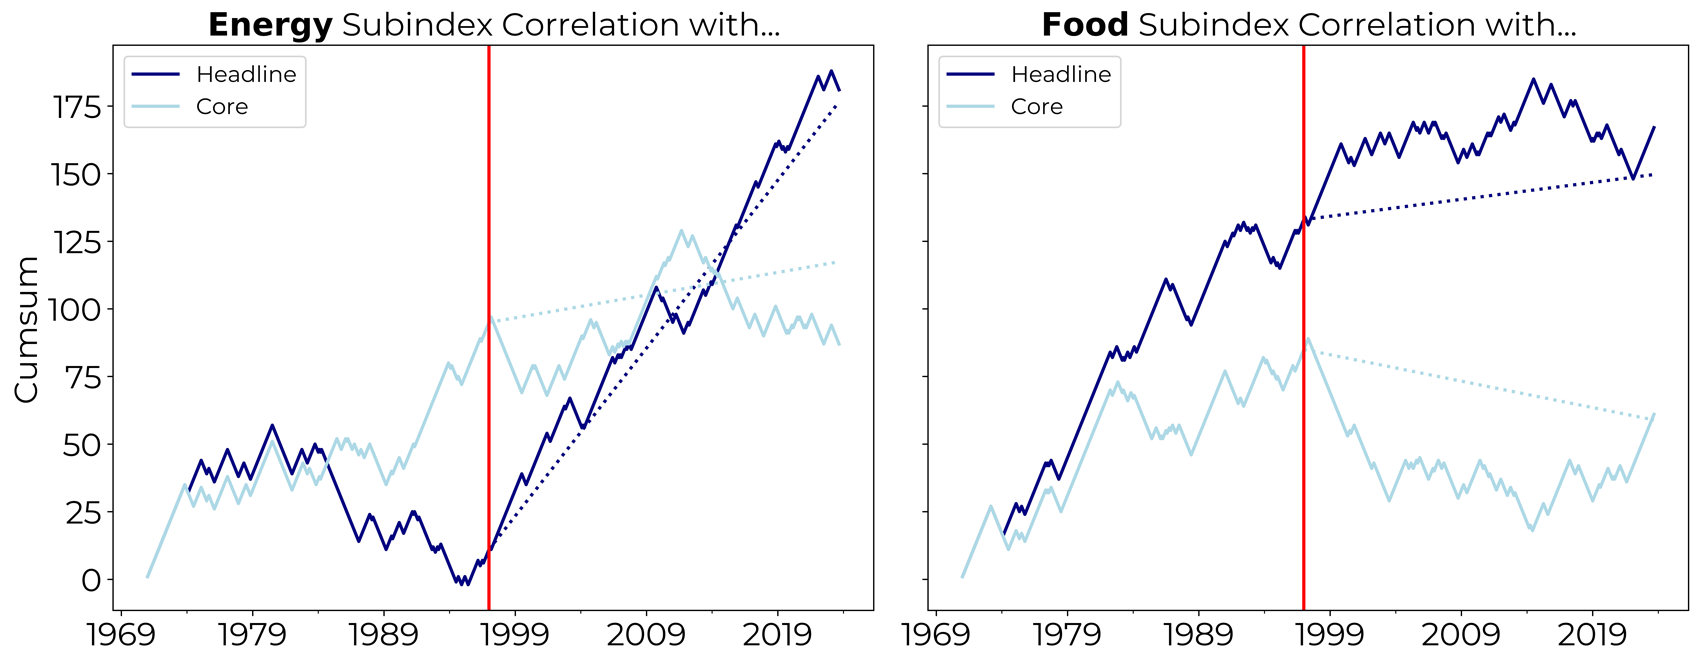
Immediately apparent from the plot in figure 1 is the observation that the YoY percentage changes of core and headline inflation were positively correlated until the end of the 90s and then subsequently passed to a slight negative correlation. The suggestion is that shocks to food and/or energy pass through to core inflation in the period until the end of the 90s, while this effect weakened in the period that followed. History and literature offer some plausible reasons for the break in the headline-core relationship: more flexible labor markets and wages, increased price competition owing to the e-commerce boom, less frequent and intense commodity shocks (the peace premium), reduced energy intensiveness, more certain oil supply (shale boom in the US), and maybe also the declining importance of oil as the dominant component in the total energy mix. As a result, headline inflation rarely stayed high for long, and in turn did not drive higher broad-based price pressures that filtered into core. We can also see this effect by looking at the correlation of each of headline and core inflation with the energy and food components respectively. The correlation P&Ls are shown in figure 2 where we see evidence of a decoupling of core inflation from food and energy inflation in the post 1990s period.
The other obvious observation from figure 1 is that the change in the correlation of headline and core inflation neatly overlaps with the bond-equity correlation flipping from positive into negative territory. In previous work we posited that a more credible central bank was in part responsible for anchoring inflation expectations, and, subsequently, making negative bond-equity correlation more likely. With a belief that central banks had successfully brought inflation under control, investors now deemed sovereign paper a legitimate store of value – especially in those times of severe equity market distress. With inflation expectations anchored, sovereign paper could now be sought as a defensive, (‘flight-to-quality’) investment if and when concerns about future equity returns flooded the market, with investors confident that monetary policy could be loosened safely, if need be, without stoking inflation.
The commitment by the Federal Reserve (and other central banks) to maintain a low and stable rate of inflation, reflected in the widespread adoption of inflation targeting strategies during the 90s, may have led to an improvement in the policy tradeoff that made it possible to have a smaller impact of a given commodity shock on both inflation and output simultaneously.
However, the result here suggests that the Federal Reserve’s job of anchoring inflation expectations was made easier by the decreased correlation between headline and core inflation. With a reduced transmission from headline to core, temporary spikes in headline inflation did not de-anchor inflation expectations, and the Fed did not have to aggressively adjust monetary policy as much as it once did6.
A future scenario where the transmission mechanism from headline to core reverts to that observed pre-90s is not now wholly inconceivable. The world is faced with elevated geopolitical risks (likelihood of more frequent and sustained commodity shocks), onshoring (structurally increasing the cost of production); ageing populations (higher fiscal burden); the green transition (intensifying race for resources); more labor rights activism – all individually and in combination – could boost the pass-through mechanism from headline to core. The longer a period of sustained high headline inflation, the greater the risk of second-round effects as consumers and investors begins to build this higher inflation into their expectations. This could be the trigger for de-anchoring inflation expectations, since consumers and investors may start to question not necessarily the credibility, but the ability of the Federal reserve to respond to curbing inflation. And, if history is any guide, this could prompt a lower level of negative correlation between bonds and equities thus lowering the diversification potential of traditional portfolios.
1Interested readers are encouraged to review our paper Bond equity correlations: are the times a-changin’? available on our website
2 In earlier parts of this miniseries, we first proposed an alternative method to measure the co-movement between bonds and equities; we then extended this approach by measuring the co-movement of bonds with equity sectors; and, finally, we extended this approach once more to study the correlation between bonds and equity risk factors.
3 As a reminder, our alternative measure is the multiplicative product of the sign of change of financial securities or indices. If these changes are of opposite sign (+1 and -1), the multiplicative product is negative. Conversely, for changes of the same sign (+1 and +1 / -1 and -1), the multiplicative product is positive. This yields a time series of +1s and -1s. Taking the cumulative sum of this multiplicative product time series yields a ‘correlation P&L’ which is upward (downward) sloping if the two securities or indices move in the same (opposite) direction.
4 The look-back period to 1971 is not arbitrary. That was the year the US went off the gold standard and the US Federal Reserve no longer controlled bank reserves and money supply as monetary policy tool but interest rates.
5 We fit and remove the linear trend from the inflation indices resulting in the ‘detrended’ index. This procedure strips out the overarching trend, crucial for an always-increasing index like an inflation index as it reveals underlying patterns and dynamics that the persistent upward trend might otherwise obscure.
6 Looking back at the Federal Funds Target Rate since 1971, the frequency as well as magnitude of monetary policy decisions declined after the end of the 1990s.
Disclaimer
ANY DESCRIPTION OR INFORMATION INVOLVING MODELS, INVESTMENT PROCESSES OR ALLOCATIONS IS PROVIDED FOR ILLUSTRATIVE PURPOSES ONLY AND DOES NOT CONSTITUTE INVESTMENT ADVICE. ANY STATEMENTS REGARDING CORRELATIONS OR MODES OR OTHER SIMILAR BEHAVIORS CONSTITUTE ONLY SUBJECTIVE VIEWS, ARE BASED UPON REASONABLE EXPECTATIONS OR BELIEFS, AND SHOULD NOT BE RELIED ON. ALL STATEMENTS HEREIN ARE SUBJECT TO CHANGE DUE TO A VARIETY OF FACTORS INCLUDING FLUCTUATING MARKET CONDITIONS AND INVOLVE INHERENT RISKS AND UNCERTAINTIES BOTH GENERIC AND SPECIFIC, MANY OF WHICH CANNOT BE PREDICTED OR QUANTIFIED AND ARE BEYOND CFM’S CONTROL. FUTURE EVIDENCE AND ACTUAL RESULTS OR PERFORMANCE COULD DIFFER MATERIALLY FROM THE INFORMATION SET FORTH IN, CONTEMPLATED BY OR UNDERLYING THE STATEMENTS HEREIN.