There is a paradox at the center of active equity management that rarely gets discussed in polite company. Every textbook, every risk committee, every consultant tells fund managers to diversify: spread your bets, don’t let any single position dominate. This is sensible advice, rooted in decades of portfolio theory. It has also been, over the past decade, the single largest reason active managers have trailed the market.
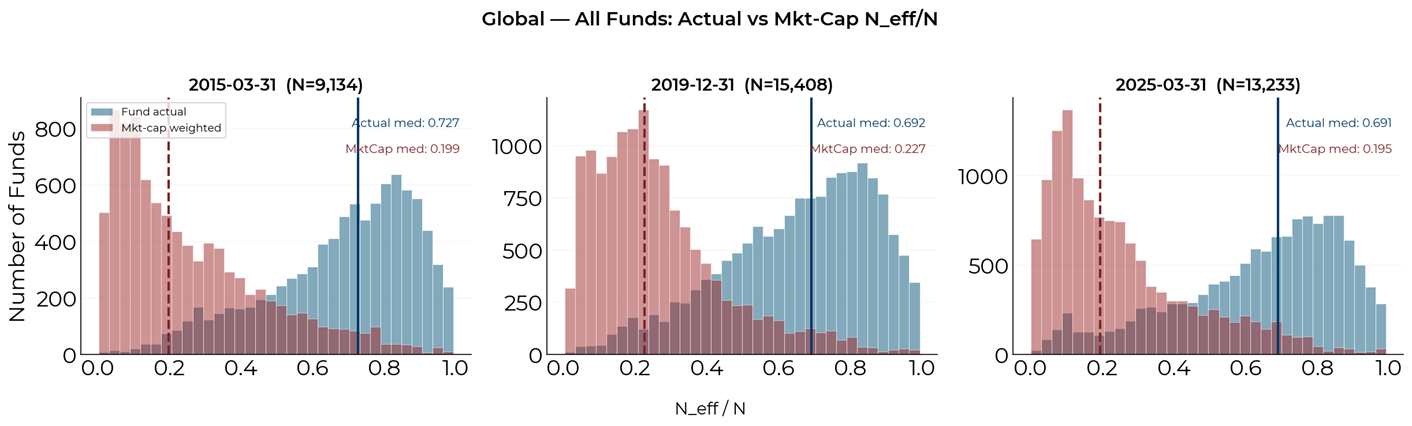
To understand why, one needs to examine what institutional equity portfolios actually hold and compare that to what the market itself looks like. We did this using the FactSet mutual fund holdings database, which covers the equity positions of open-ended mutual funds globally. The database includes over 13,000 funds at any given point. For each fund, we computed a measure of portfolio concentration: the normalized effective number of holdings, or N_eff/N. A fund that equal-weights all its positions scores close to 1. One that concentrates everything in a handful of names scores close to 0. We then computed the same metric for a hypothetical portfolio holding the same stocks but weighted by market capitalization, as an index fund would.
The gap between the two distributions is wide and persistent. At every date in our sample, roughly 95% of institutional funds hold portfolios that are more equally weighted than the cap-weighted version of the same stocks. The median fund sits at a normalized effective number of holdings of approximately 0.69. The cap-weighted equivalent comes in at roughly 0.19. Put simply, the typical active fund distributes its capital far more evenly than the index does. This is the predictable consequence of risk limits, concentration guidelines, and the basic instinct of any sensible portfolio manager not to stake too much on a single name.
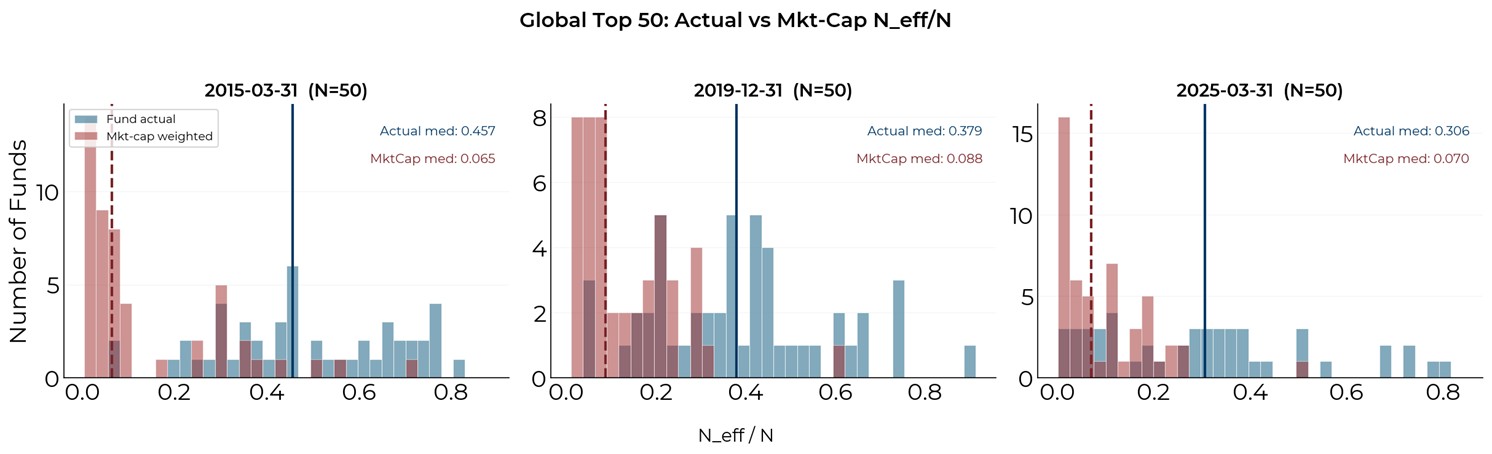
The picture becomes more interesting when one narrows the lens to the largest funds. We repeated the analysis for the 50 biggest global mutual funds by assets under management at each date. Many are large index-tracking or quasi-index vehicles, collectively representing hundreds of billions of dollars, whose trading activity has an outsized influence on the stocks they hold.
The top 50 sit closer to cap-weighting than the broader universe, as one would expect from funds of their size, but they are still considerably more diversified than pure market-cap weighting would produce. In 2015, the median actual N_eff/N among these funds was 0.46, against a cap-weighted benchmark of 0.065. What is more revealing is the direction of travel. By 2019, the actual median had fallen to 0.38, by 2025, it stood at 0.31. The cap-weighted benchmark for these same holdings has remained remarkably low throughout, hovering between 0.06 and 0.09 across the entire period. Even as the funds themselves have drifted towards greater concentration, with their median falling from 0.46 to 0.31, they remain roughly four to five times more diversified than a cap-weighted portfolio of their own stocks would be. Despite a decade of market forces pulling portfolios towards mega-cap dominance, these funds have resisted that pull far more than the market structure would suggest is optimal for tracking index returns.
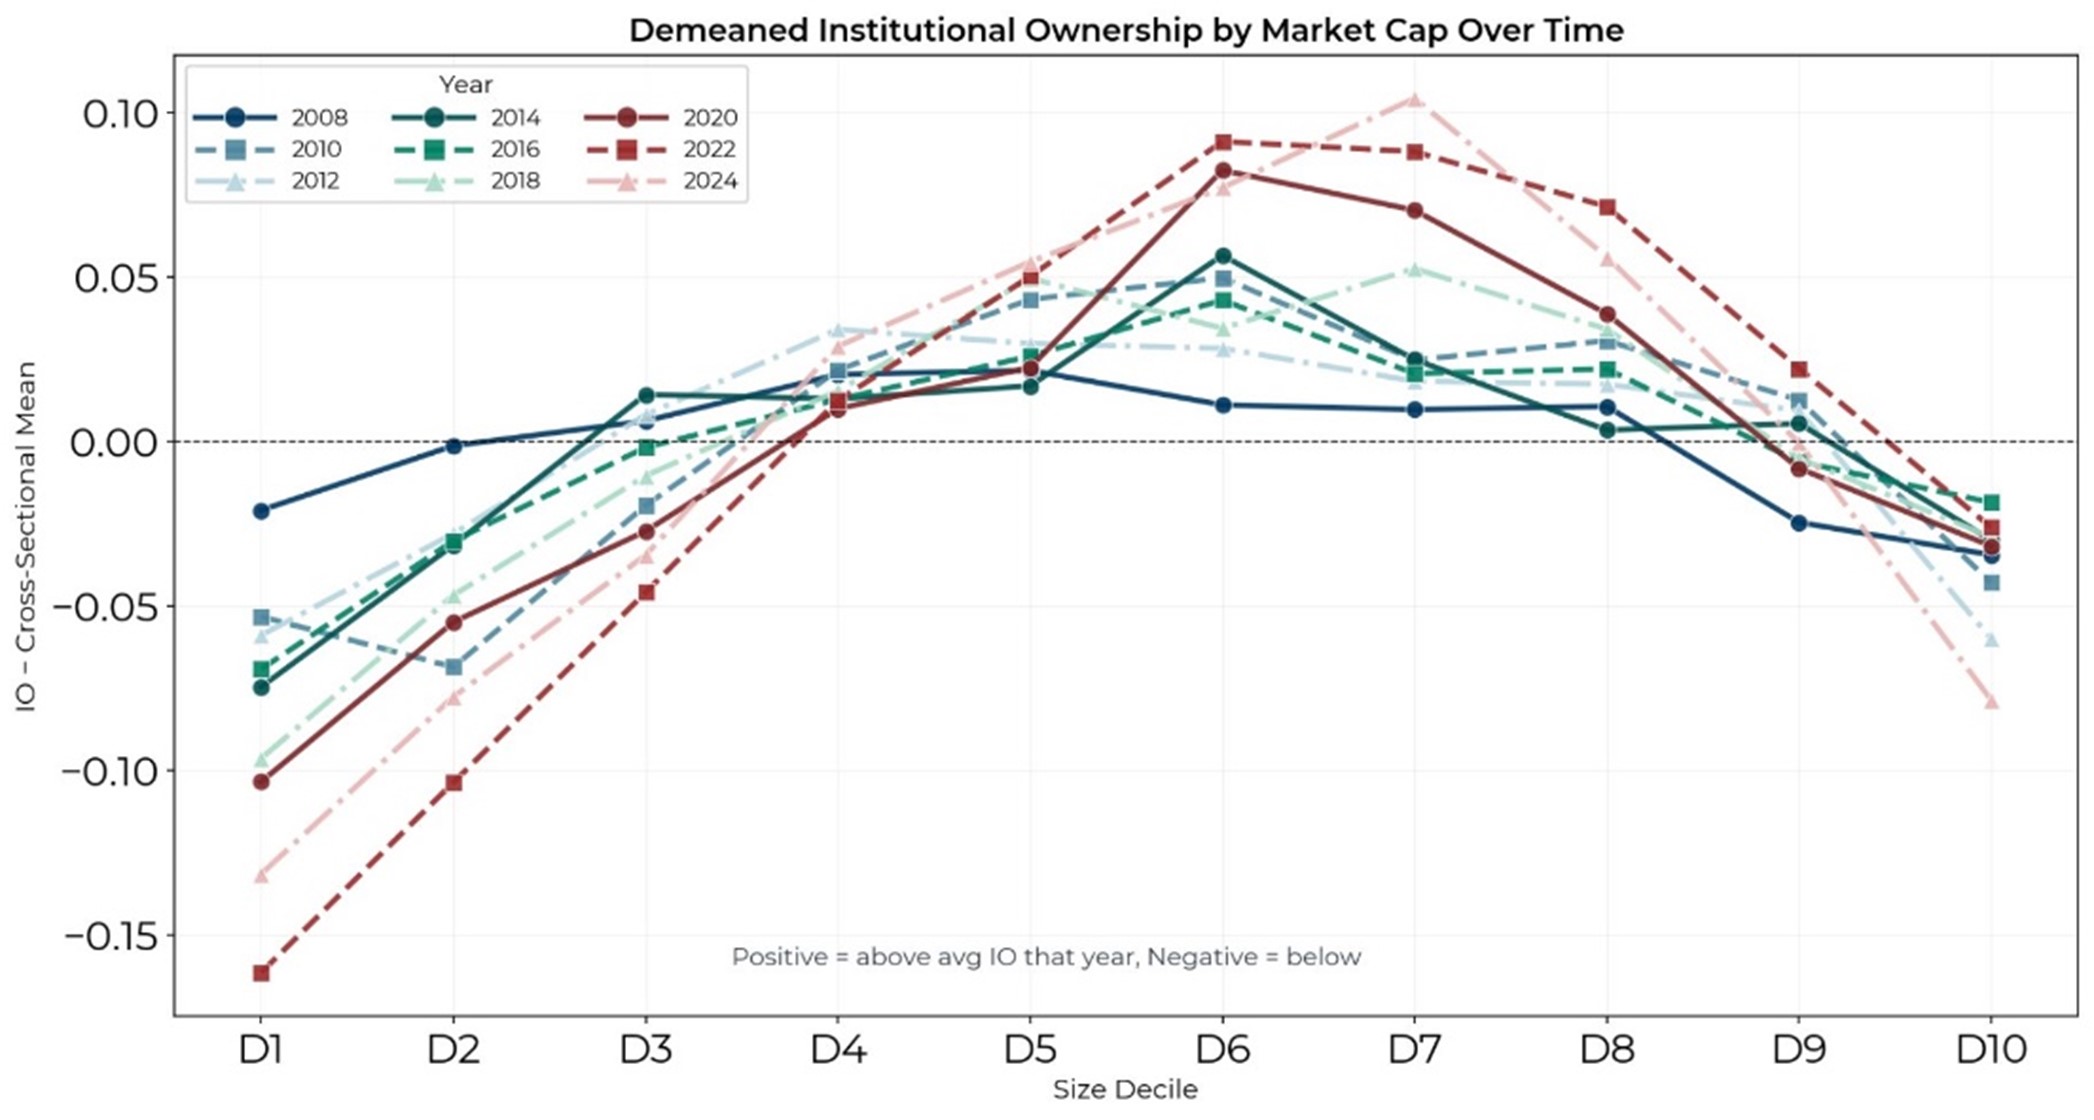
Where exactly has this resistance shown up? To answer that, we moved from portfolio-level concentration metrics to the cross-sectional distribution of institutional ownership across market-cap deciles, examining how the shape of that distribution has evolved over time.
The profile has undergone a remarkable transformation. In the earlier years of the sample, institutions displayed a relatively gentle allocation hump, modestly overweighting mid-to-large-cap stocks in the D5 to D8 range relative to the annual cross-sectional average, with both the smallest and largest deciles sitting slightly below average. The curve was comparatively flat. By 2020, and more strikingly by 2022 and 2024, the hump has sharpened dramatically. The peak around D6 has risen to nearly 10 percentage points above the cross-sectional mean, while both ends of the distribution have fallen further below it.
The right side of the curve tells the most consequential part of the story: deciles D9 and D10, which contain the mega-caps, have dropped from roughly average institutional ownership in the early years to well below average by 2024, even as these stocks have grown to represent an ever-larger share of the index. Institutions have not simply maintained their longstanding preference for mid-cap diversification. They have intensified it, concentrating their overweight more tightly in the middle of the capitalization spectrum and pulling further away from both extremes. Had market returns been evenly spread across the capitalization spectrum, this tilt towards the middle would have been of little consequence. But returns have been anything but evenly spread.
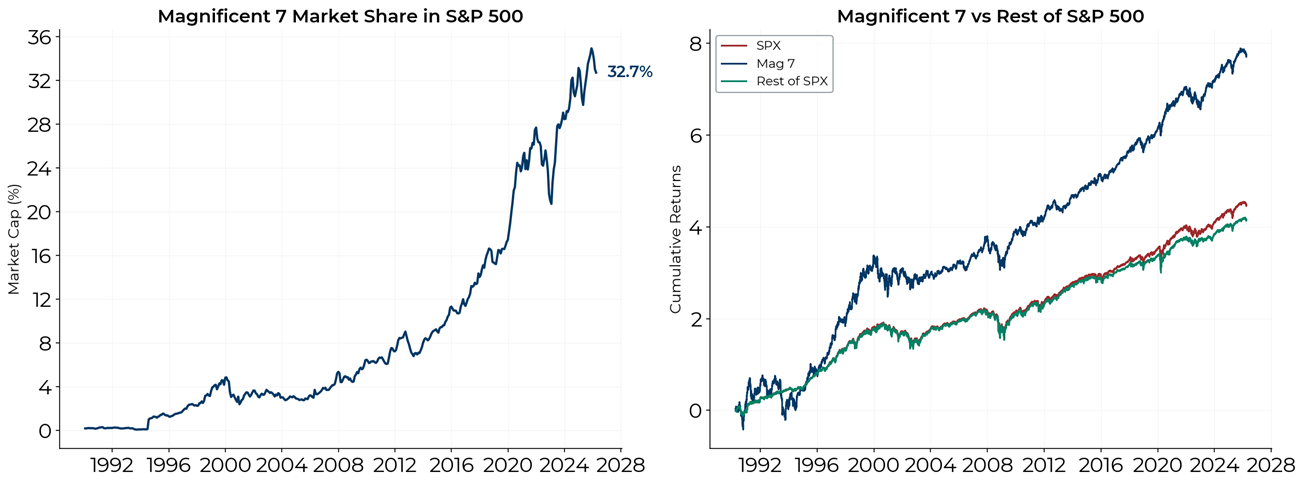
The Magnificent Seven now account for roughly a third of the S&P 500 by market capitalization, a degree of concentration with few precedents in the index’s modern history. More pertinently for the active management debate, these seven stocks have dramatically outpaced the rest of the index over the very period in which institutions have been reducing their relative exposure to the largest names. By 2025, a dollar invested in the Mag 7 at the start of the period would have grown to roughly eight times its original value, compared with roughly four times for the remaining stocks. Unlike the dot-com episode, where a handful of loss-making technology companies were propelled by speculative mania, this outperformance has been sustained over many years and substantially underpinned by genuine earnings growth across all seven names.
The four figures compose a single, coherent account of why active equity management has found itself in such difficulty. Funds distribute their capital far more evenly than cap-weighting dictates. Even the largest funds, despite drifting towards greater concentration, have not kept pace with how concentrated the market’s returns have become. Institutions have been actively reducing their relative ownership of the largest stocks over the past several years. Those largest stocks have delivered sustained, earnings-driven outperformance that a diversified portfolio is mechanically unable to capture in full. A fund holding 2% of its portfolio in Nvidia when the index weight is 5% will lag every time Nvidia outpaces the average stock, whatever skill the manager brings to the remaining 98% of the portfolio.
This is not a story about a failure of fundamental analysis or an absence of stock-picking talent. It is a story about portfolio construction conventions that are entirely rational from a risk management perspective, colliding with a market structure that has become historically abnormal. The diversification that risk committees demand, that consultants endorse, and that modern portfolio theory provides the intellectual justification for, has been the primary drag on active performance in a market where returns have been concentrated in an ever-shrinking number of names. Managers who ran more concentrated books and allowed their winners to compound unchecked would have fared considerably better, but they would also have taken on precisely the kind of benchmark-deviating, single-name risk that most institutional mandates exist to prevent.
The question that ought to occupy allocators is whether this regime persists, because the answer determines whether the structural headwind facing diversified active portfolios remains in place or reverses into a tailwind. History offers some guidance. The Nifty Fifty era of the early 1970s, when a handful of blue-chip growth stocks traded at extraordinary valuations and dominated institutional portfolios, ended with a prolonged period of mean reversion that rewarded broader market participation. The dot-com peak of 2000 produced an even more dramatic unwind, as the mega-cap technology stocks that had driven the index fell by 70-80% while the rest of the market held up comparatively well. In both episodes, investors who had maintained diversified portfolios through the period of peak concentration, enduring the associated years of relative underperformance, were eventually rewarded when the market broadened.
Whether the current episode follows the same trajectory or represents something genuinely different—a permanent shift in market structure driven by the network economics of technology platforms and the capital intensity of artificial intelligence—is a question that the data alone cannot settle. What the data can tell us is that the global fund industry, as currently constituted, is positioned for a broadening of returns away from the mega-caps. If and when that broadening materializes, the same diversification that has been a source of persistent underperformance could become a significant advantage. The trap, in time, may yet become the trade.
DISCLAIMER
Any description or information involving modes, investment processes or allocations is provided for illustrative purposes only and does not constitute investment advice nor an offer or solicitation to subscribe for any security or interest. Any statements regarding correlations or modes or other similar behaviors constitute only subjective views, are based upon reasonable expectations or beliefs, and should not be relied on. All statements herein are subject to change due to a variety of factors including fluctuating market conditions and involve inherent risks and uncertainties both generic and specific, many of which cannot be predicted or quantified and are beyond cfm’s control. Future evidence and actual results or performance could differ materially from the information set forth in, contemplated by or underlying the statements herein. CFM accepts no liability for any inaccurate, incomplete or omitted information of any kind or any losses caused by using this information. CFM does not give any representation or warranty as to the reliability or accuracy of the information contained in this document.