Listen to this blog
The Hidden Beta in Dip Trade
Few phrases in finance carry as much emotional weight as “buy the dip.” Its appeal is intuitive: markets tend to go up over time, so a sudden drop must represent a discount. For some asset classes such as equity indices, the back test of “buy the dip” conducted on a long-drifting market tends to look profitable. However, it is important to recognize that part of any such strategy’s return is passive drift, not timing skill. The real question, then, is whether timing dips unlock genuine alpha or whether what we call “buying the dip” is just an expensive bet on long beta wearing a clever disguise.
To separate the long drift from the timing skill, we run a rather simple test. We regress each dip-buying strategy against the passive portfolio an investor would otherwise have held. The residual, what is left once the passive exposure is removed, has then no long-run link to the benchmark. Whatever return it shows can only come from picking the right days to be active. The test is conducted twice: once on a 60/40 portfolio, and once on the infamous retail strategy of short volatility.
A 60 percent S&P 500 and 40 percent US Treasury total return portfolio has returned around 0.7 Sharpe ratio since 1995, a respectable baseline for anything that claims to do better. It also happens to be the cleanest possible testbed for dip-buying, because the instrument being traded and the drift to be removed are the same object. The signal is generated from the 60/40’s own daily return, standardized by a rolling 60-day volatility. Dips are then grouped into three buckets of increasing severity: mild (0.5 to 1 standard deviations), moderate (1 to 2), and severe (beyond 2). On any triggering day the strategy goes long the portfolio for five sessions and then exits.
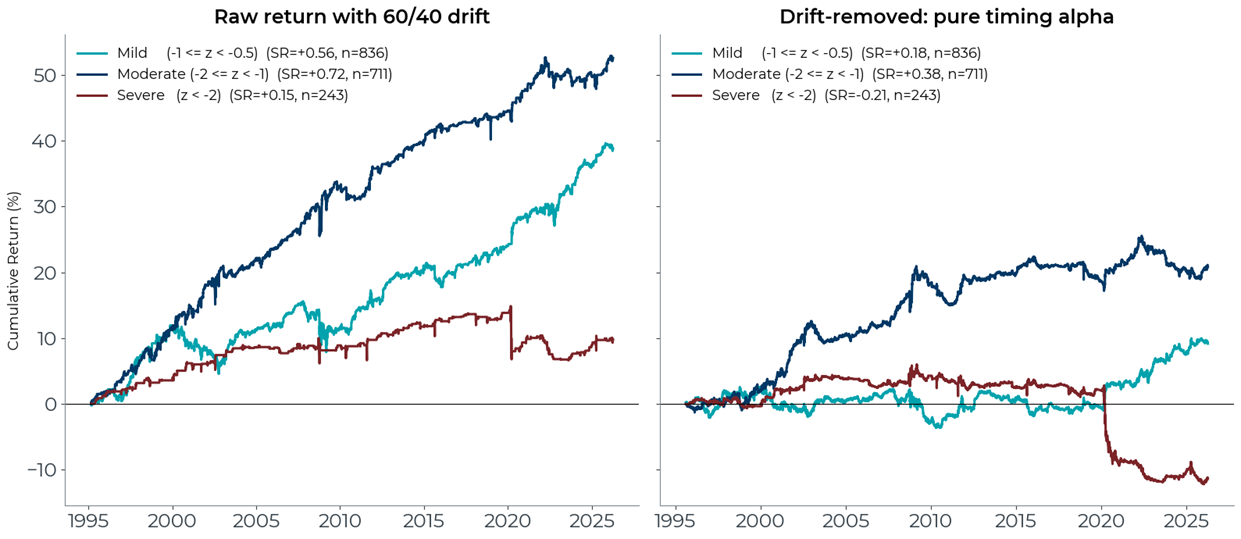
Chart 1: The 60/40 dip-buyer, before and after drift removal - Cumulative return from buying mild (−1 to −0.5 sd), moderate (−2 to −1 sd), and severe (below −2 sd) dips on a 60/40 portfolio since 1995, with positions held for five trading days. The left panel shows raw P&L. The right panel shows the same strategy after subtracting a rolling-beta exposure to the 60/40, which is equivalent to being short the portfolio on days when the strategy is flat and sizing the short so that long-run 60/40 exposure is zero. The legend shows 'n' as the number of times the strategy is triggered.
The left panel in Chart 1 shows what “buy the dip” looks like in raw returns across severity buckets. Moderate dips appear to work, delivering a 0.72 Sharpe ratio and climbing steadily to 50% cumulative gains. In reality, once we strip away the passive drift of owning a 60/40 portfolio, the outperformance deteriorates. Moderate dips shrink to 0.38, mild dips collapse to 0.18 and severe crashes, where “buy the dip” is most psychologically compelling, turn negative. For the traditional 60/40 portfolio, what appears to be dip-buying opportunities in fact are simply capturing the equity risk premium during periods when the 60/40 happens to recover. Critically, this analysis doesn’t yet factor in the real-world costs: brokerage fees, market impact, and the operational overhead of running a systematic timing strategy would only widen the gap between the raw returns and true net alpha.
We now turn to another well-known strategy that amplifies this timing bet through leverage: shorting volatility after VIX spikes.
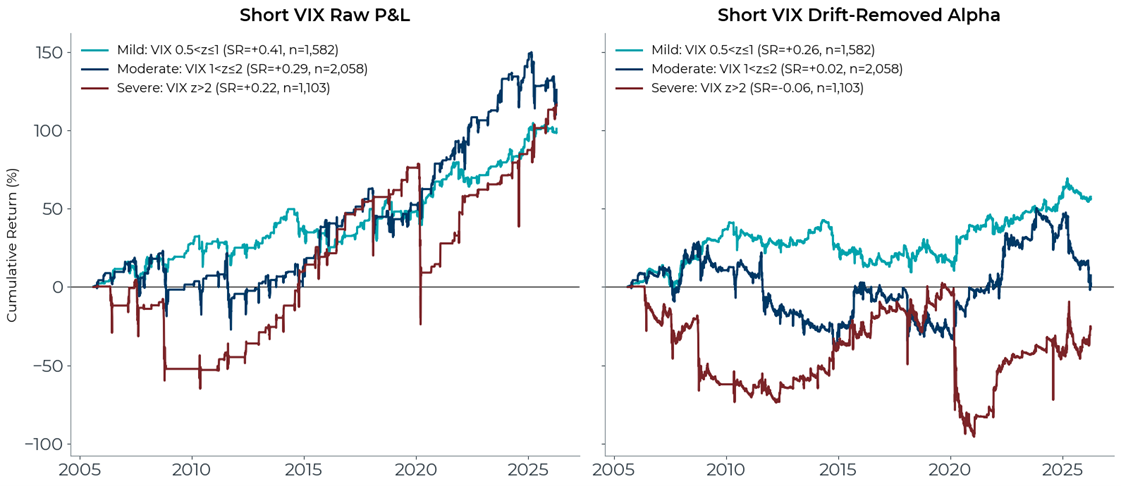
Chart 2: The Short Volatility, before and after drift removal - Cumulative return from shorting VIX futures on mild (0.5 < z ≤ 1), moderate (1 < z ≤ 2), and severe (z > 2) VIX spikes since 2005, with positions held for five trading days. The left panel shows raw P&L. The right panel shows the same strategy after subtracting a rolling-beta exposure to SPX, which isolates the contribution of volatility timing independent of equity exposure. A trader who shorts VIX on spikes intends to profit from volatility mean-reversion, but much of the raw return comes from accidental exposure to equity rallies. The right panel reveals what remains once this unintended equity exposure is removed. The legend shows 'n' as the number of times the strategy is triggered.
Chart 2 presents the buy-the-dip strategy of short-VIX futures across all three severity buckets. Mild spikes show the best resilience with modest returns: raw 0.41 Sharpe shrinks to 0.26. Moderate spikes deteriorate further, collapsing from 0.29 raw to 0.02 alpha, indistinguishable from noise. Most consequentially, severe VIX spikes (z > 2) are where short-VIX traders stake their conviction and where the illusion becomes most dangerous. Raw returns earn a seemingly attractive 0.22 Sharpe ratio, outpacing the severe 60/40 dip trade. Yet, once we residualize against the SPX itself, the picture inverts catastrophically. Severe VIX spikes plunge to −0.06 Sharpe, a 125% drift ratio, worse than any other strategy tested.
The mechanism is straightforward: when volatility spikes, short-VIX traders enter leveraged positions betting on mean-reversion but, in so doing, are also taking a leveraged long bet on SPX beta. The 2020 episode is instructive: severe VIX spikes preceded the worst equity crash in a decade, and short-VIX traders faced catastrophic losses precisely when they believed mean-reversion was most certain.
The 60/40 dip-buyer and the short-VIX trader arrive at the same destination via different routes: negative alpha after removing passive exposure. For the 60/40 investor, the illusion is subtle: markets genuinely do recover after crashes, creating the appearance of timing skill until you realize you would have profited anyway by staying invested. For the short-VIX trader, the illusion is acute: leverage amplifies profits during normal times until the regime breaks and leverage amplifies losses during the one period when it matters most. Markets reveal a brutal asymmetry that the dips most likely to trigger action are the least likely to reward it over beta exposure.
The buy-the-dip strategy illustrates a key pitfall: long-term asset drift can mask a strategy’s true performance. Day traders often appear profitable in bull markets, particularly over the past two decades of above-average equity returns in developed markets, but their positive P&L may simply reflect a long (or short VIX) bias rather than the strategy itself. In fact, a passive buy-and-hold strategy would have delivered superior returns after accounting for transaction costs. The same dynamic applies to real estate: as property values rise, people feel justified in upgrading to larger homes, and each transaction appears profitable, except for rare market downturns like the GFC. Yet transaction taxes and costs are systematically ignored in their analysis. Recognizing these biases is essential for building robust trading strategies and portfolios.
DISCLAIMER
Any description or information involving modes, investment processes or allocations is provided for illustrative purposes only and does not constitute investment advice nor an offer or solicitation to subscribe for any security or interest. Any statements regarding correlations or modes or other similar behaviors constitute only subjective views, are based upon reasonable expectations or beliefs, and should not be relied on. All statements herein are subject to change due to a variety of factors including fluctuating market conditions and involve inherent risks and uncertainties both generic and specific, many of which cannot be predicted or quantified and are beyond cfm’s control. Future evidence and actual results or performance could differ materially from the information set forth in, contemplated by or underlying the statements herein. CFM accepts no liability for any inaccurate, incomplete or omitted information of any kind or any losses caused by using this information. CFM does not give any representation or warranty as to the reliability or accuracy of the information contained in this document.