Seven Degrees of Market Structure
Summary
Markets are fascinating. They have persistent long-term structural features — like momentum and volatility clustering — but they also evolve, shift, and adapt to an ever-changing mix of participants, technologies, and financial innovations.
In this note, we examine seven topical features of today’s market structure:
- The liquidity backdrop
- The democratization of markets
- The speculation economy
- The rise of ‘rules-based’ investing
- The options explosion
- Increasingly idiosyncratic markets
- ‘Buy-the-dip’ psychology
The Liquidity Backdrop
Several countries, including the United States, are running accommodative fiscal policies — tax cuts, deregulation, and higher spending. Easy policy stimulates investment.
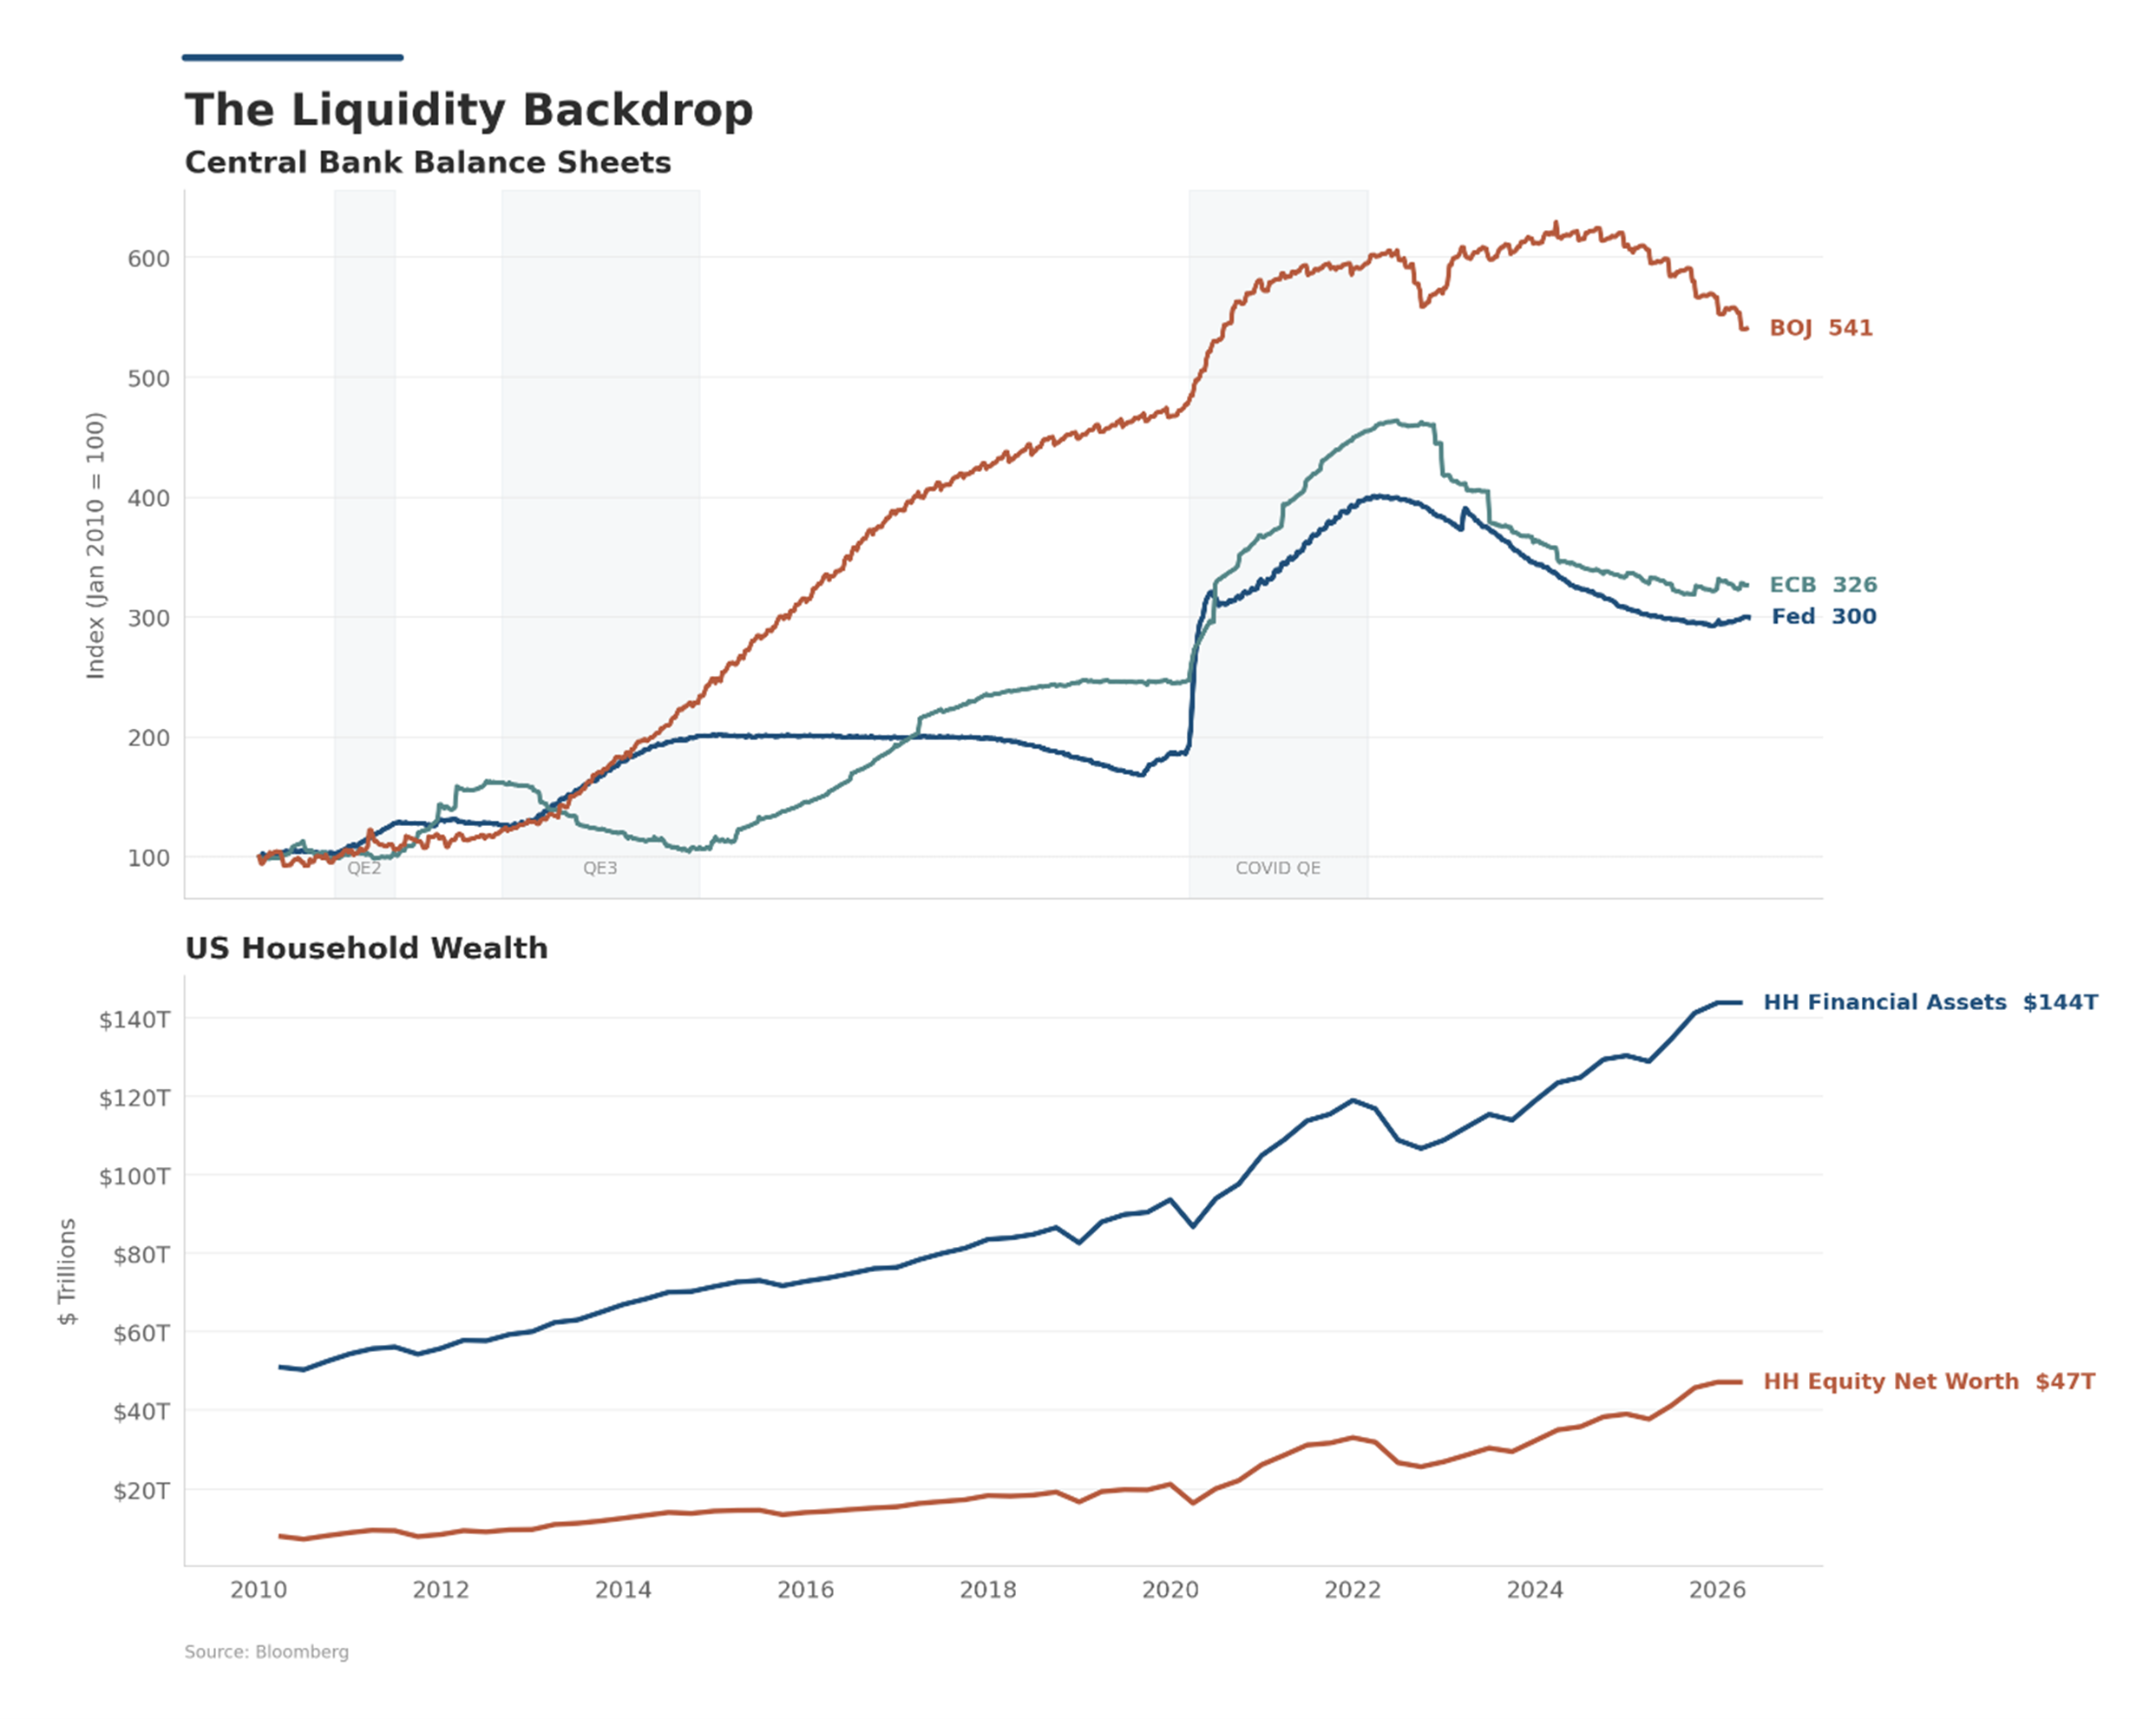
Central banks, including the US Federal Reserve (Fed), European Central Bank (ECB), and the Bank of Japan (BoJ), have expanded their balance sheets since the financial crisis, partly to keep long-end yields anchored. This is a form of financial repression that pushes money into riskier investments with higher expected returns. As shown in Figure 1, central bank balance sheets have expanded 3-6x since 2010, with the BoJ the clear outlier. Fed and ECB balance sheets have run off modestly from their 2022 peaks but remain at multiples of pre-2020 levels. US household financial assets have grown in lockstep, reaching $144 trillion today, of which $47 trillion sits in direct equity.
In the short run, these easy policy settings have immediate impacts on growth and add liquidity to the financial system. In the long run, it is population growth and productivity that drive economic growth and the creation of wealth.
The Democratization of Markets
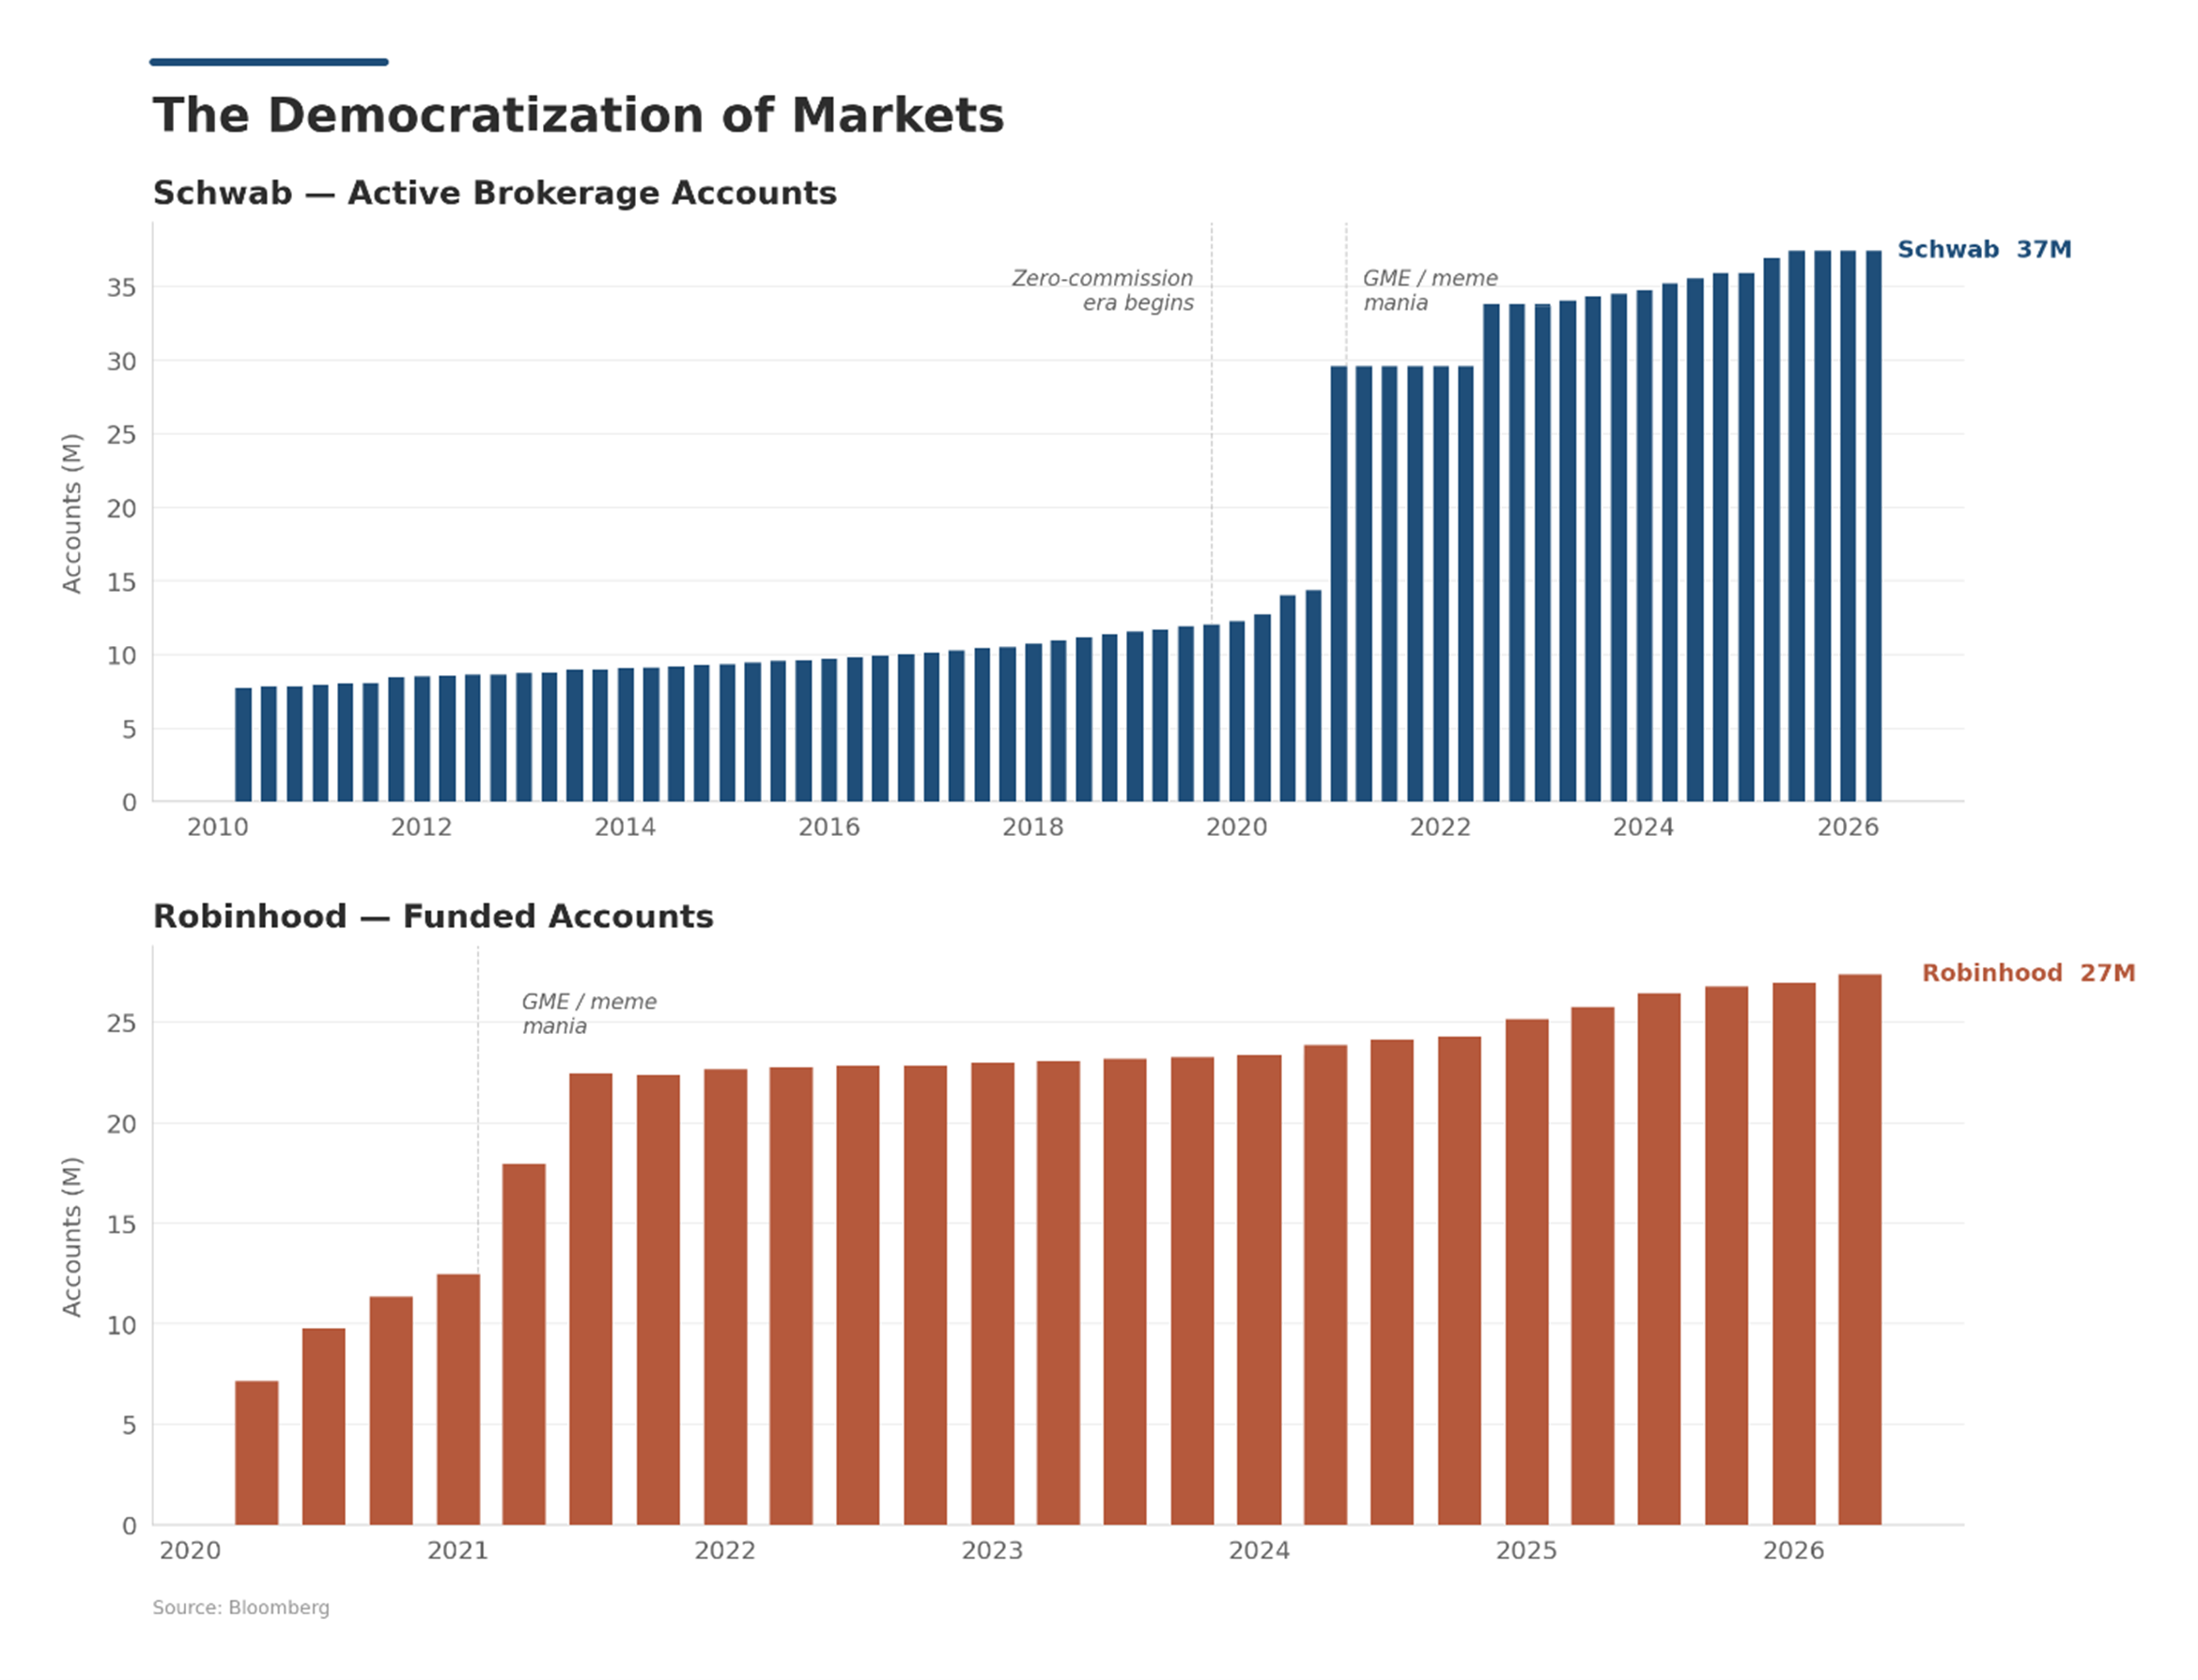
Access to markets has been democratized by ever-improving technology and the rise of low-cost investing. In the US, Schwab’s active brokerage accounts have nearly quadrupled since 2010, and Robinhood has gone from zero to 27 million funded accounts in six years. Both saw clear inflections at the launch of zero-commission trading and the 2021 meme-stock episode (see Figure 2). The 2020-2021 surge coincided with a wave of pandemic-era stimulus and forced savings, which channeled excess household cash into newly accessible markets. The phenomenon is global: other countries are replicating US platform models, and with 5.8 billion mobile phones in circulation worldwide1, the addressable market is effectively everyone with a device.
The Speculation Economy
The proliferation of devices has opened the door to new forms of speculation that now compete directly with traditional markets. Whether it’s sports betting, event contracts on platforms like Polymarket and Kalshi, or crypto, investors have a vast menu to choose from.
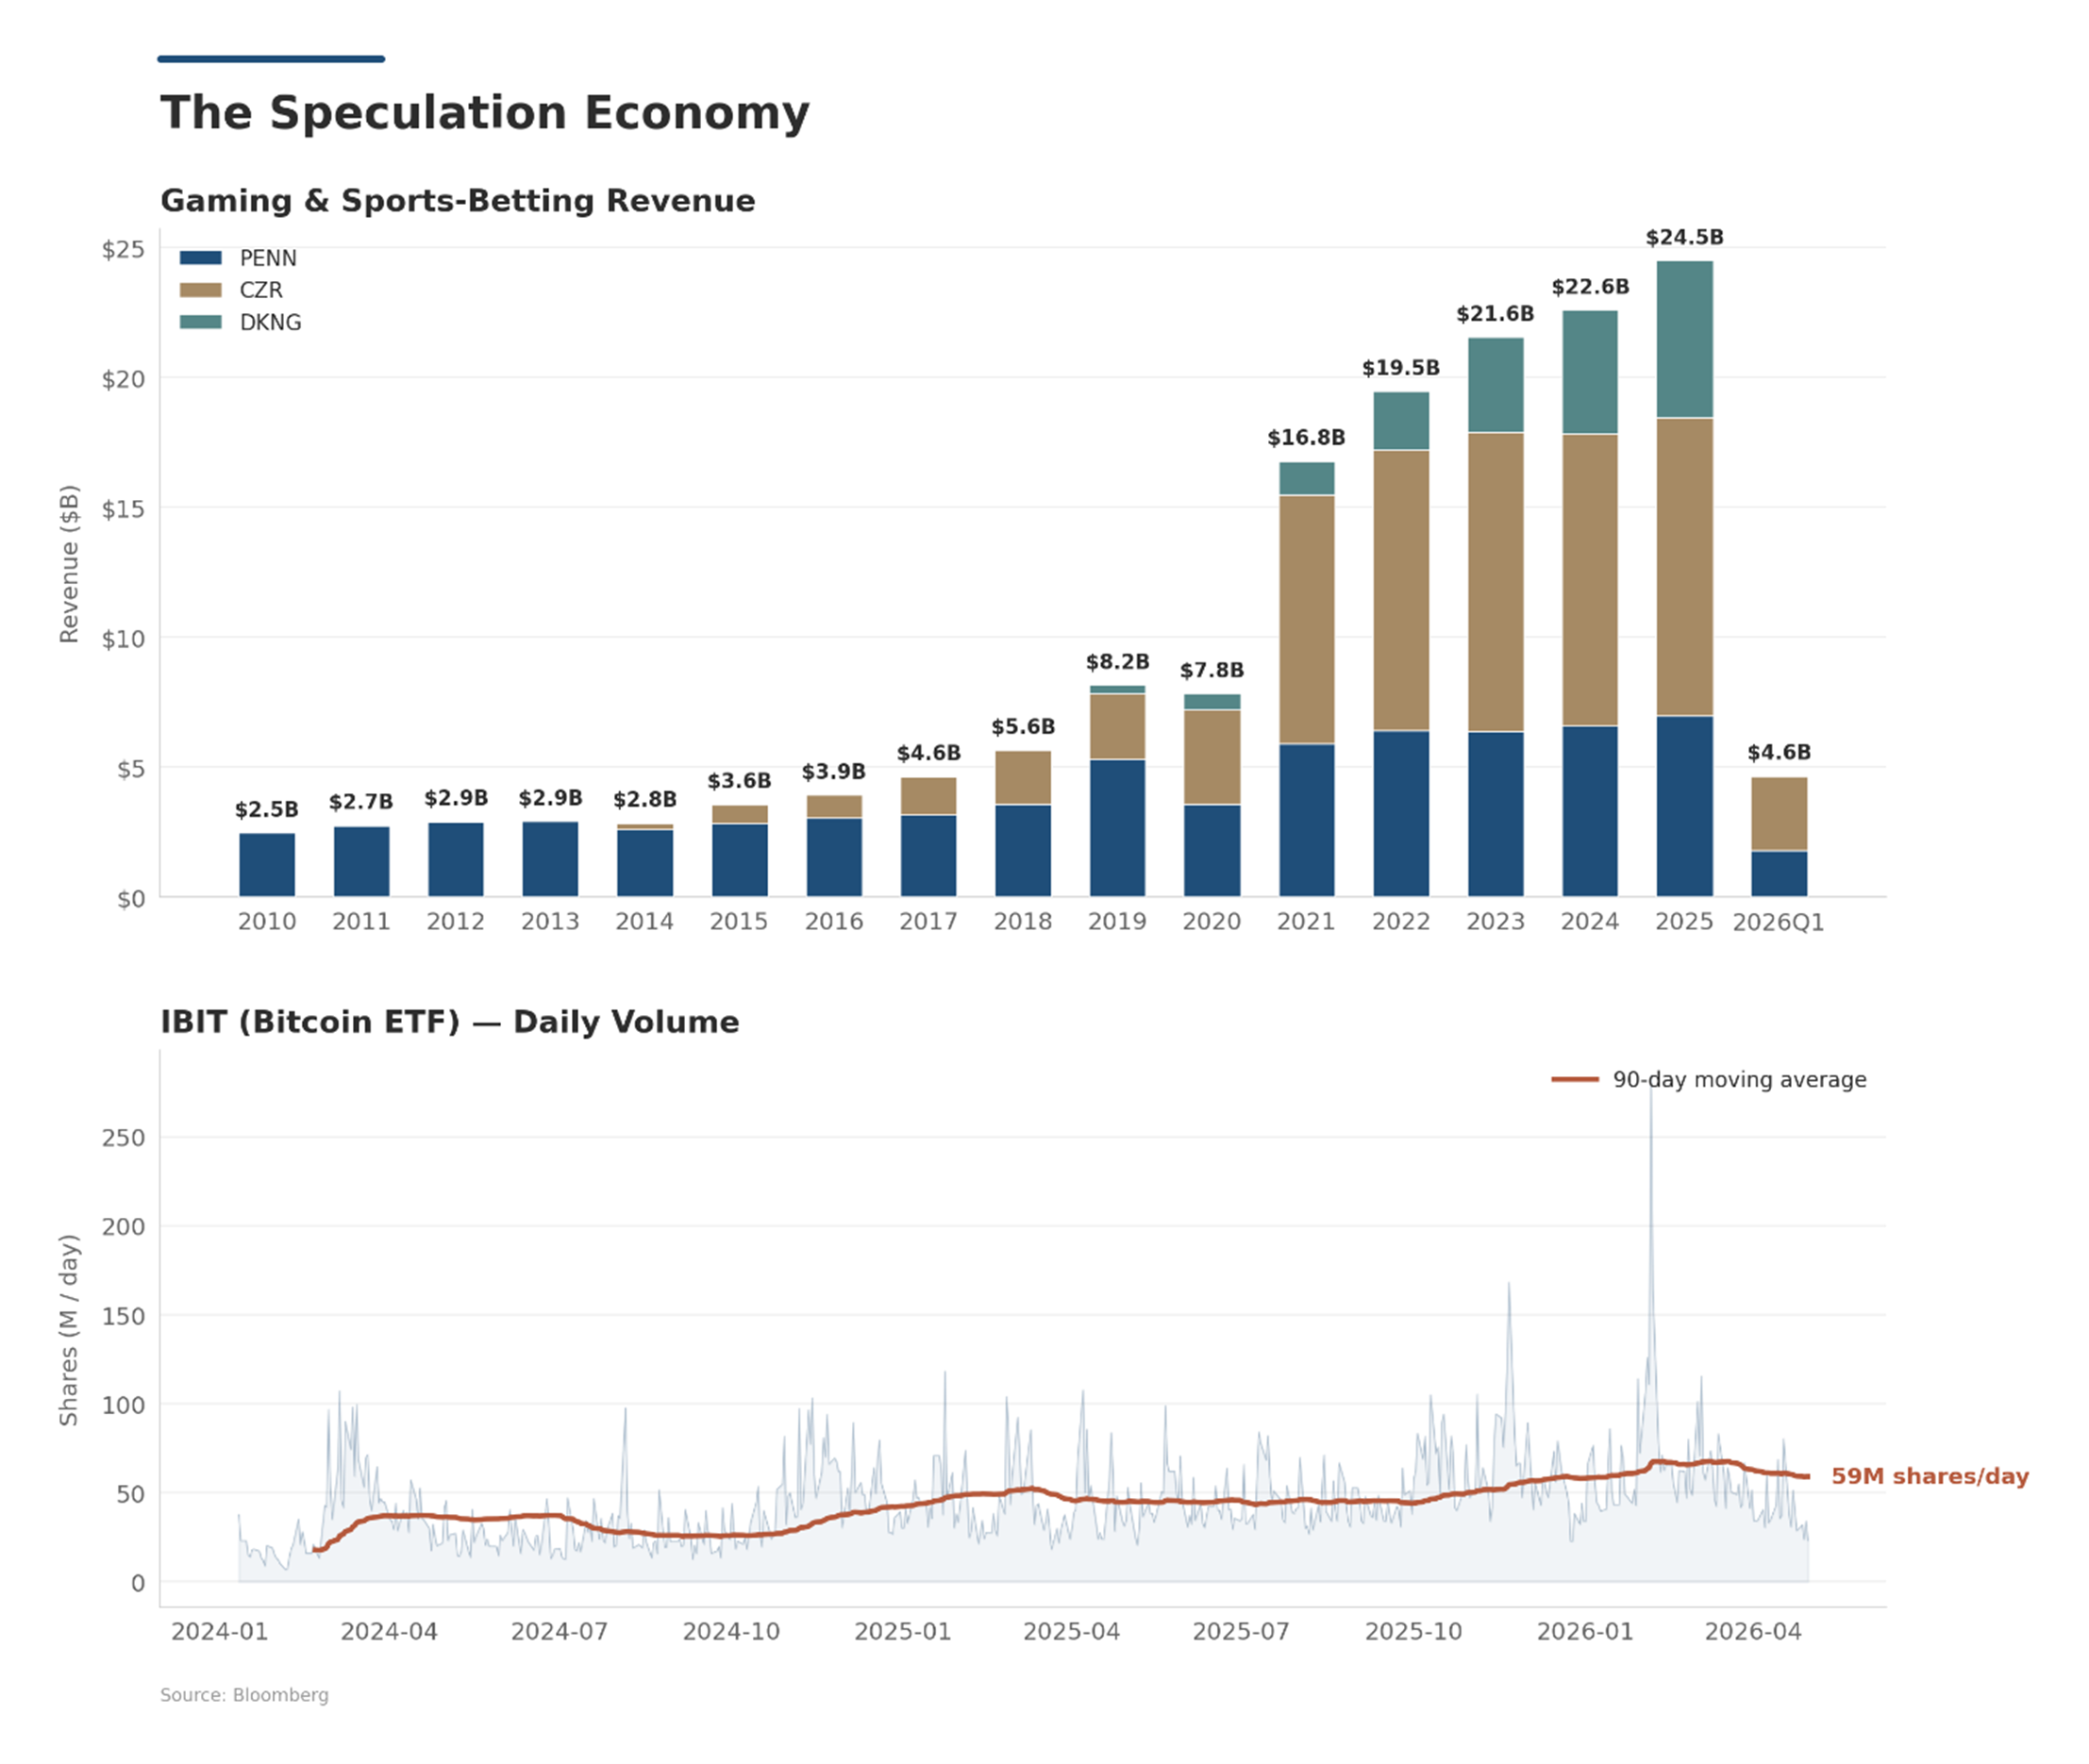
Revenue at the three largest US betting operators — Penn, Caesars, and DraftKings — has grown nearly 10x since 2010, reaching $24.5 billion in 2025, and IBIT (a Bitcoin ETF) — which didn’t exist two years ago — now trades ~59 million shares per day (see Figure 3).
The current US administration has eased regulations around these alternative venues, allowing them to grow alongside, and compete with, traditional investments. The ability to speculate continuously across markets reinforces the behavior and fuels animal spirits. Capital is fungible: flows chase the highest dopamine payoff of the moment, and the line between ‘investment’ and ‘wager’ continues to blur. The footprint shows up in positioning, volatility, and correlation across traditional markets.
The Rise of Rules-Based Investing
Rules-based investing refers to strategies that follow a predefined set of rules to capture a specific feature of markets. The amount of capital allocated to these strategies has risen significantly, and through repeated, predictable actions they leave a memory in financial asset prices.
Indexing is the largest form of ‘rules-based’ investing. Some estimates suggest that 34% of the US equity market is indexed2.
Smart beta and factor investing have also grown significantly, attracting meaningful assets under management. These strategies follow simple rules to capture market features such as momentum or value.
Leveraged strategies are also popular. SOXL, for example, has a $22 billion market cap3 and delivers three times the daily return of the Philadelphia Semiconductor Index. High-octane returns and risk attract a speculative class of investor.
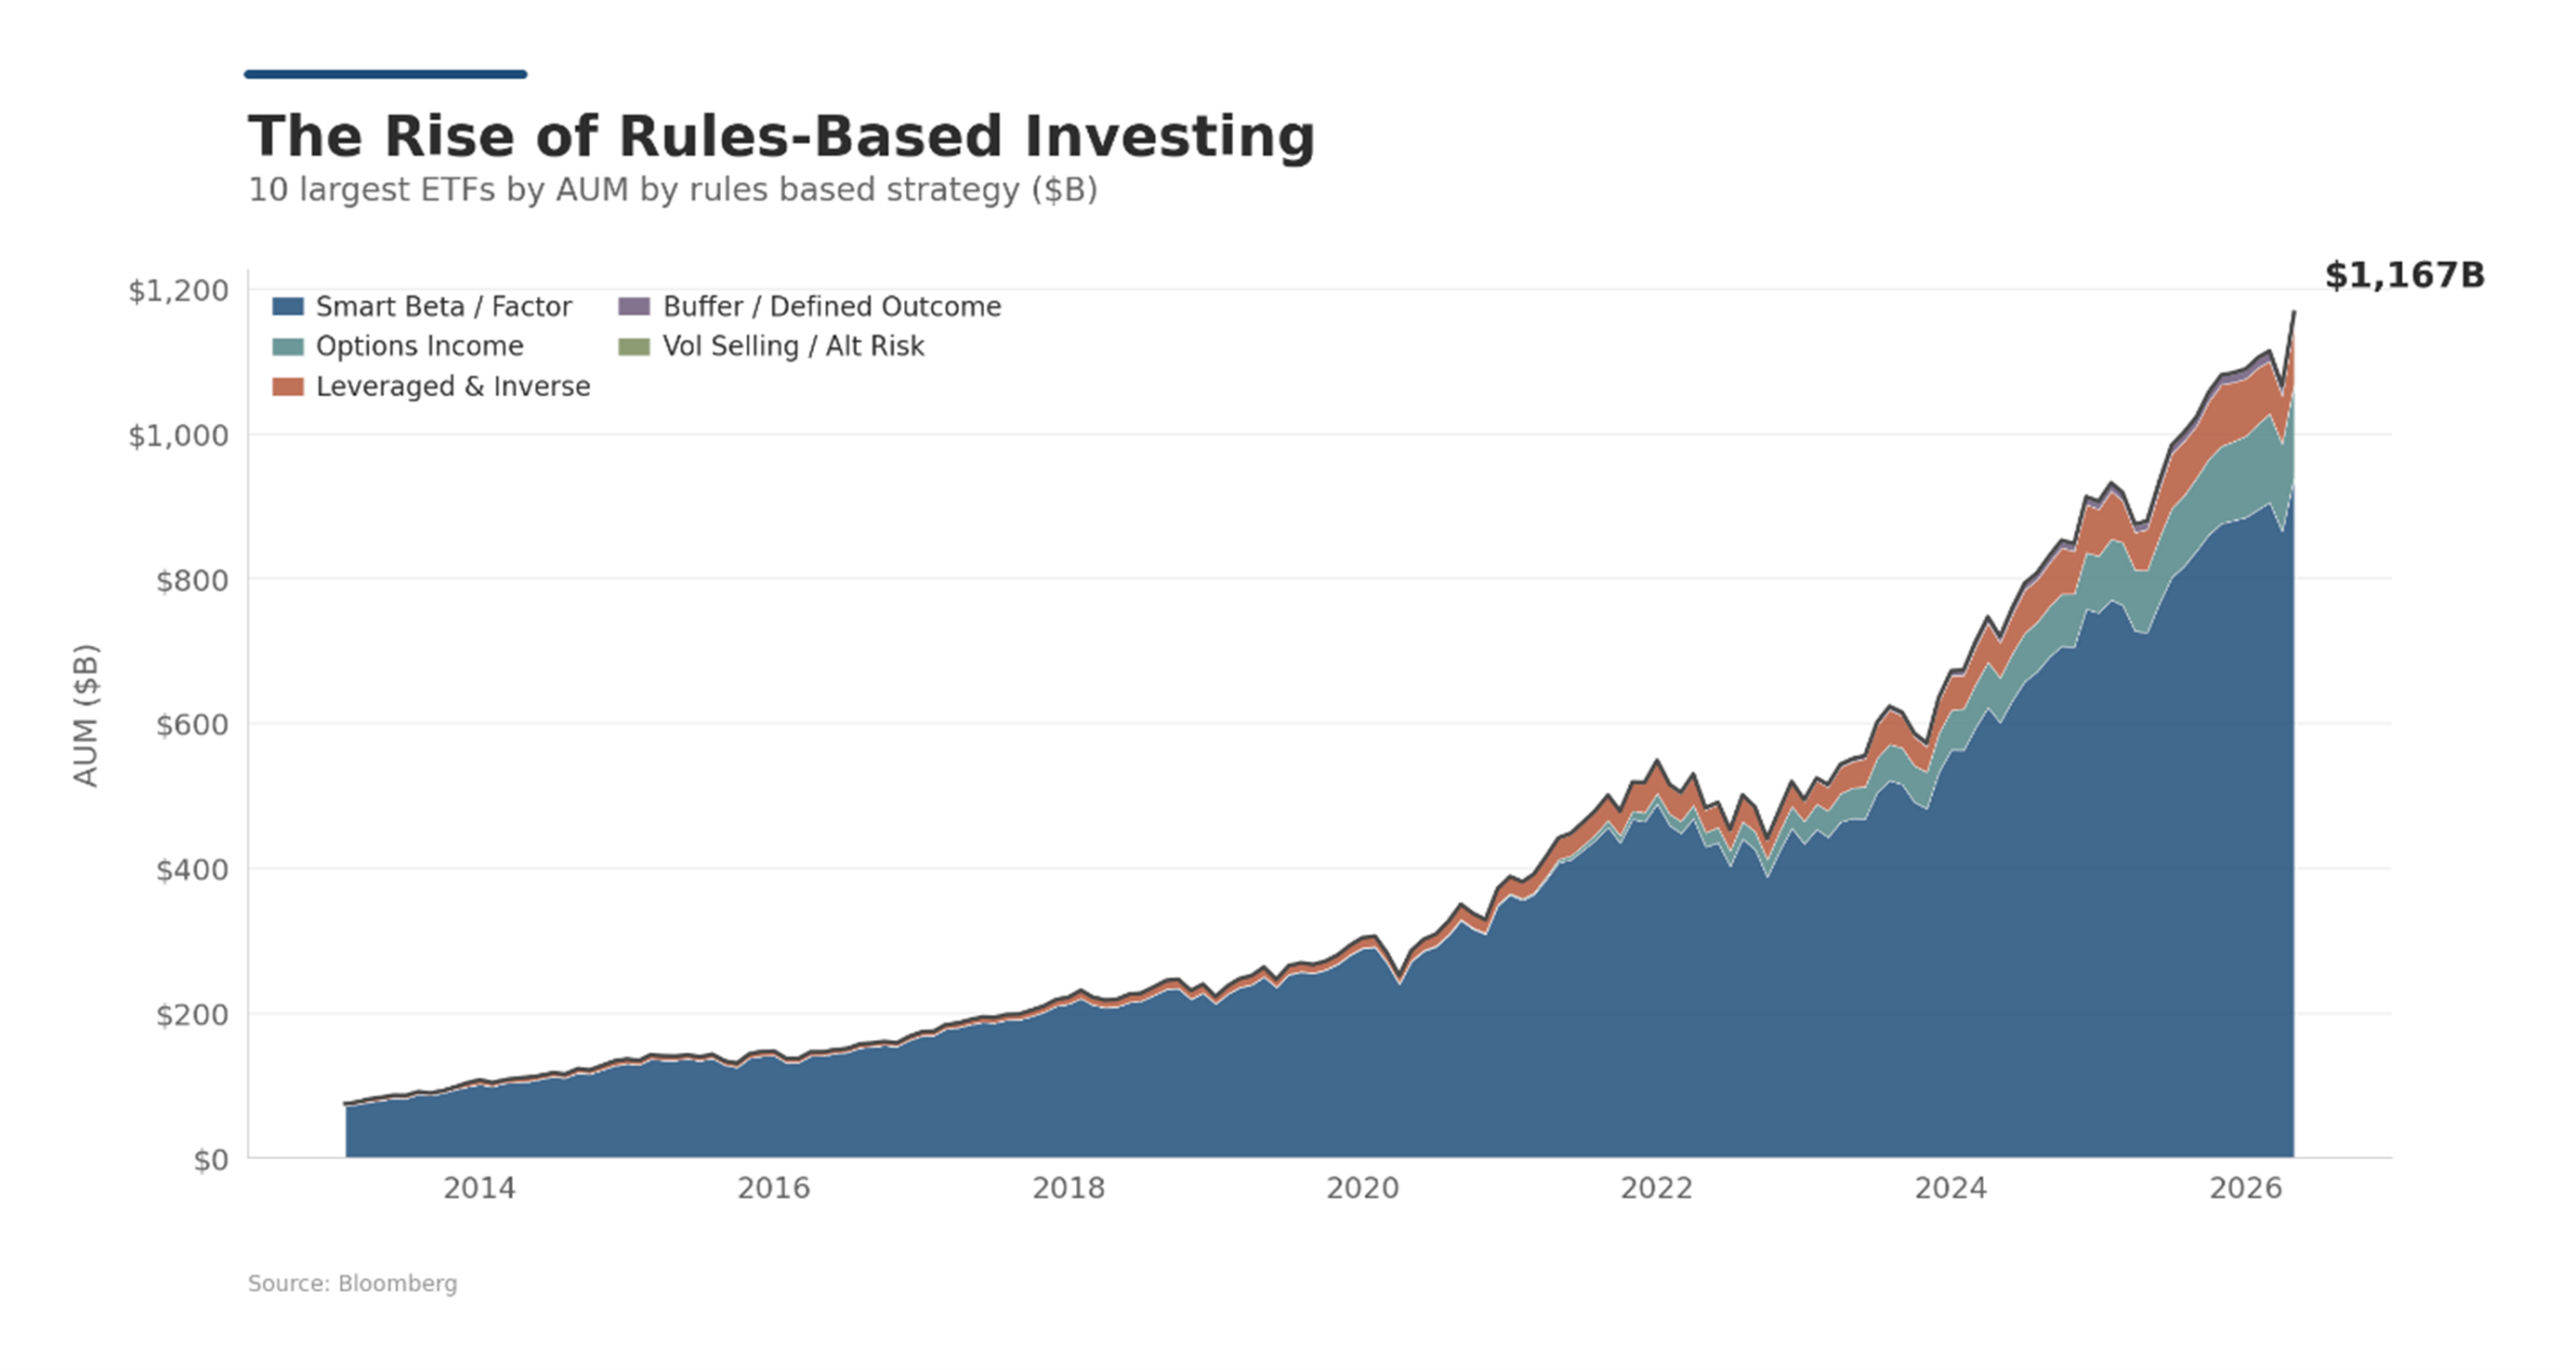
Other rules-based strategies include buffer funds, which offer tailored payoffs on different underlyings, and yield strategies, which sell volatility to collect premium. Across the ten largest ETFs in each of these categories, AUM has grown from under $100 billion in 2013 to $1.17 trillion today (see Figure 4). A roughly 12x expansion in just over a decade.
These flows are mechanical, predictable, and therefore exploitable. Levered ETFs rebalance into the close, amplifying intraday moves. Index inclusions and exclusions create multi-day drift around rebalance dates. Factor crowding produces correlated unwinds when positioning gets stretched. Outside listed ETFs, financial institutions run large quantitative investment solution businesses that replicate a whole menu of rules-based exposures, from commodity carry to tail hedging strategies. The scale of rules-based capital now means these footprints are increasingly visible in market prices.
The Options Explosion
Warren Buffett famously described derivatives as ‘weapons of mass destruction’. Another way to say this is that high leverage is embedded in the design of these contracts. Buffett also famously sold long-dated put options on a basket of three major equity indices at the nadir of the financial crisis.
An option’s sensitivity to underlying price changes increases as maturity shortens and as the spot price approaches the strike. These short-dated payoffs are appealing to investors seeking significant leverage and the ability to make repeated, short-term bets.
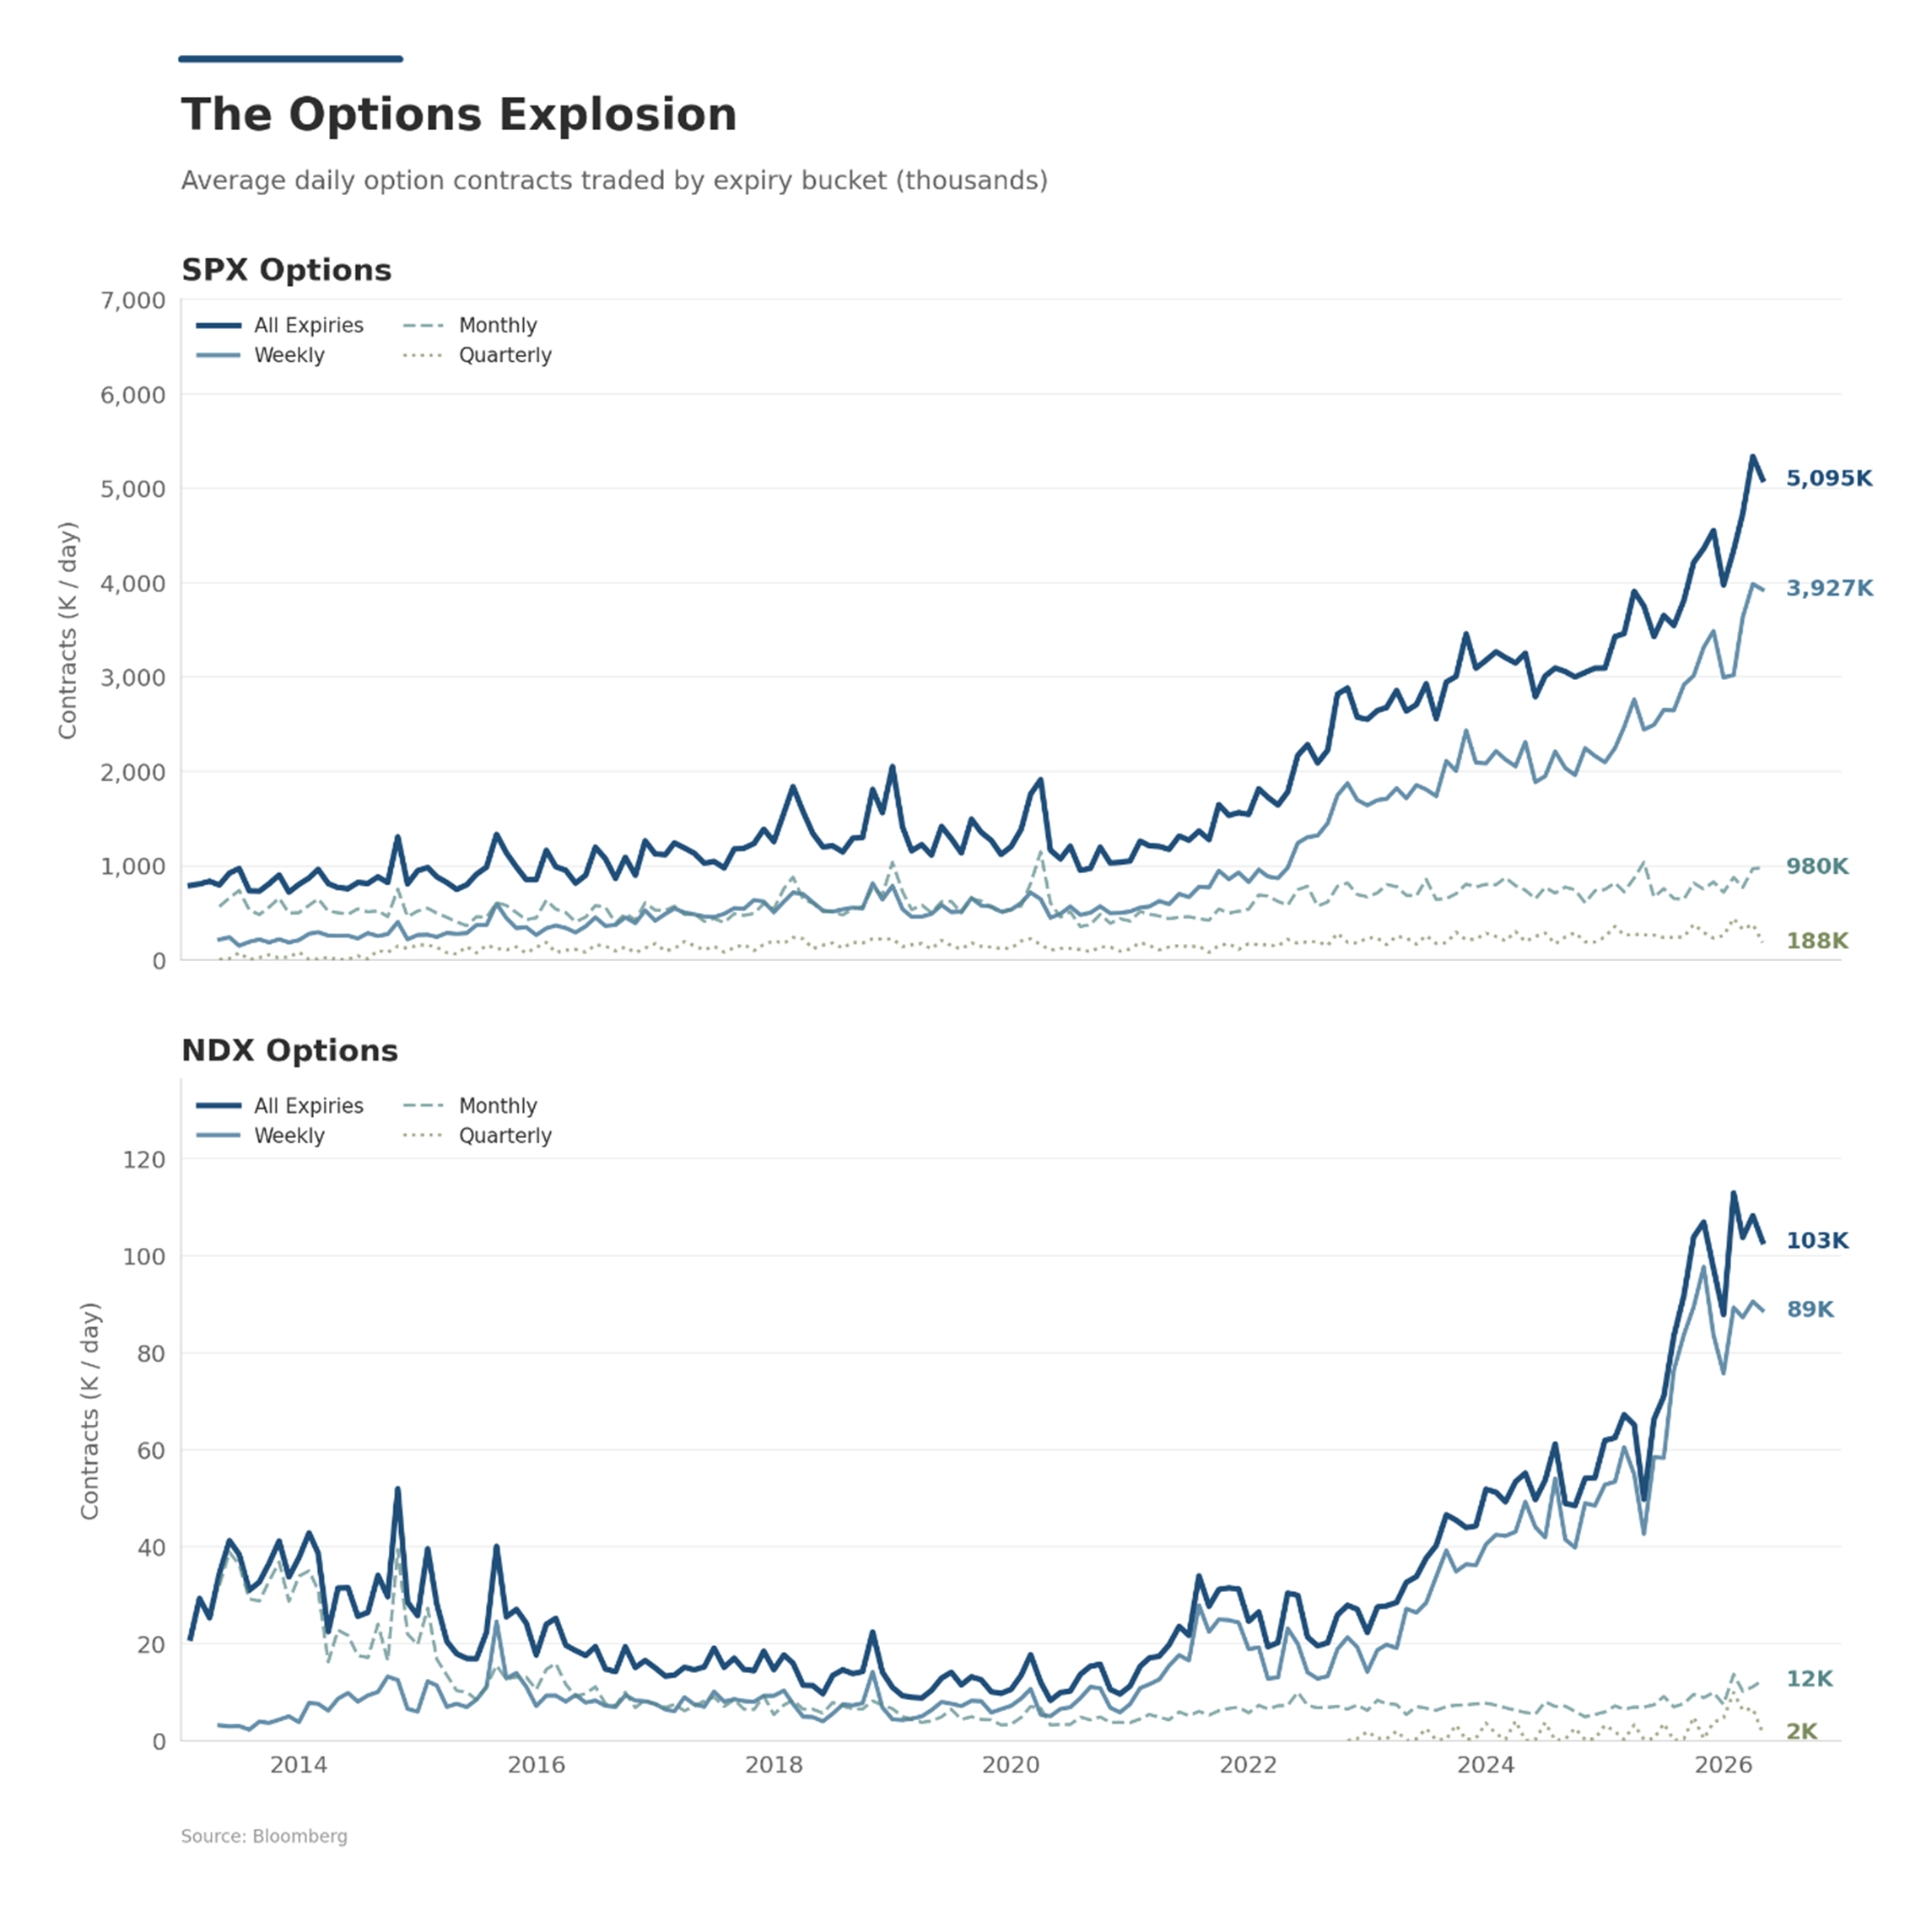
Volumes in short-dated options have exploded on the back of insatiable investor demand. S&P 500 weekly listed option volumes have grown roughly 5x since 2020, now averaging 3.9 million contracts per day, and Nasdaq weeklies have grown from near-zero to 89 thousand over the same period (see Figure 5). The explosion is concentrated in the shortest maturities: weekly volumes now dwarf monthly and quarterly combined, while longer-dated volumes have barely grown. 0DTE contracts now account for the majority of S&P 500 weekly volume.
The scale of short-dated options means dealer hedging flows — particularly around 0DTE gamma4 — now exert measurable influence on intraday price action and realized vol. Liquidity providers keep adding new underliers and shorter maturities to meet demand. Prediction markets already offer intraday bets on market variables; traditional option markets are not far behind.
Markets Are Becoming More Idiosyncratic
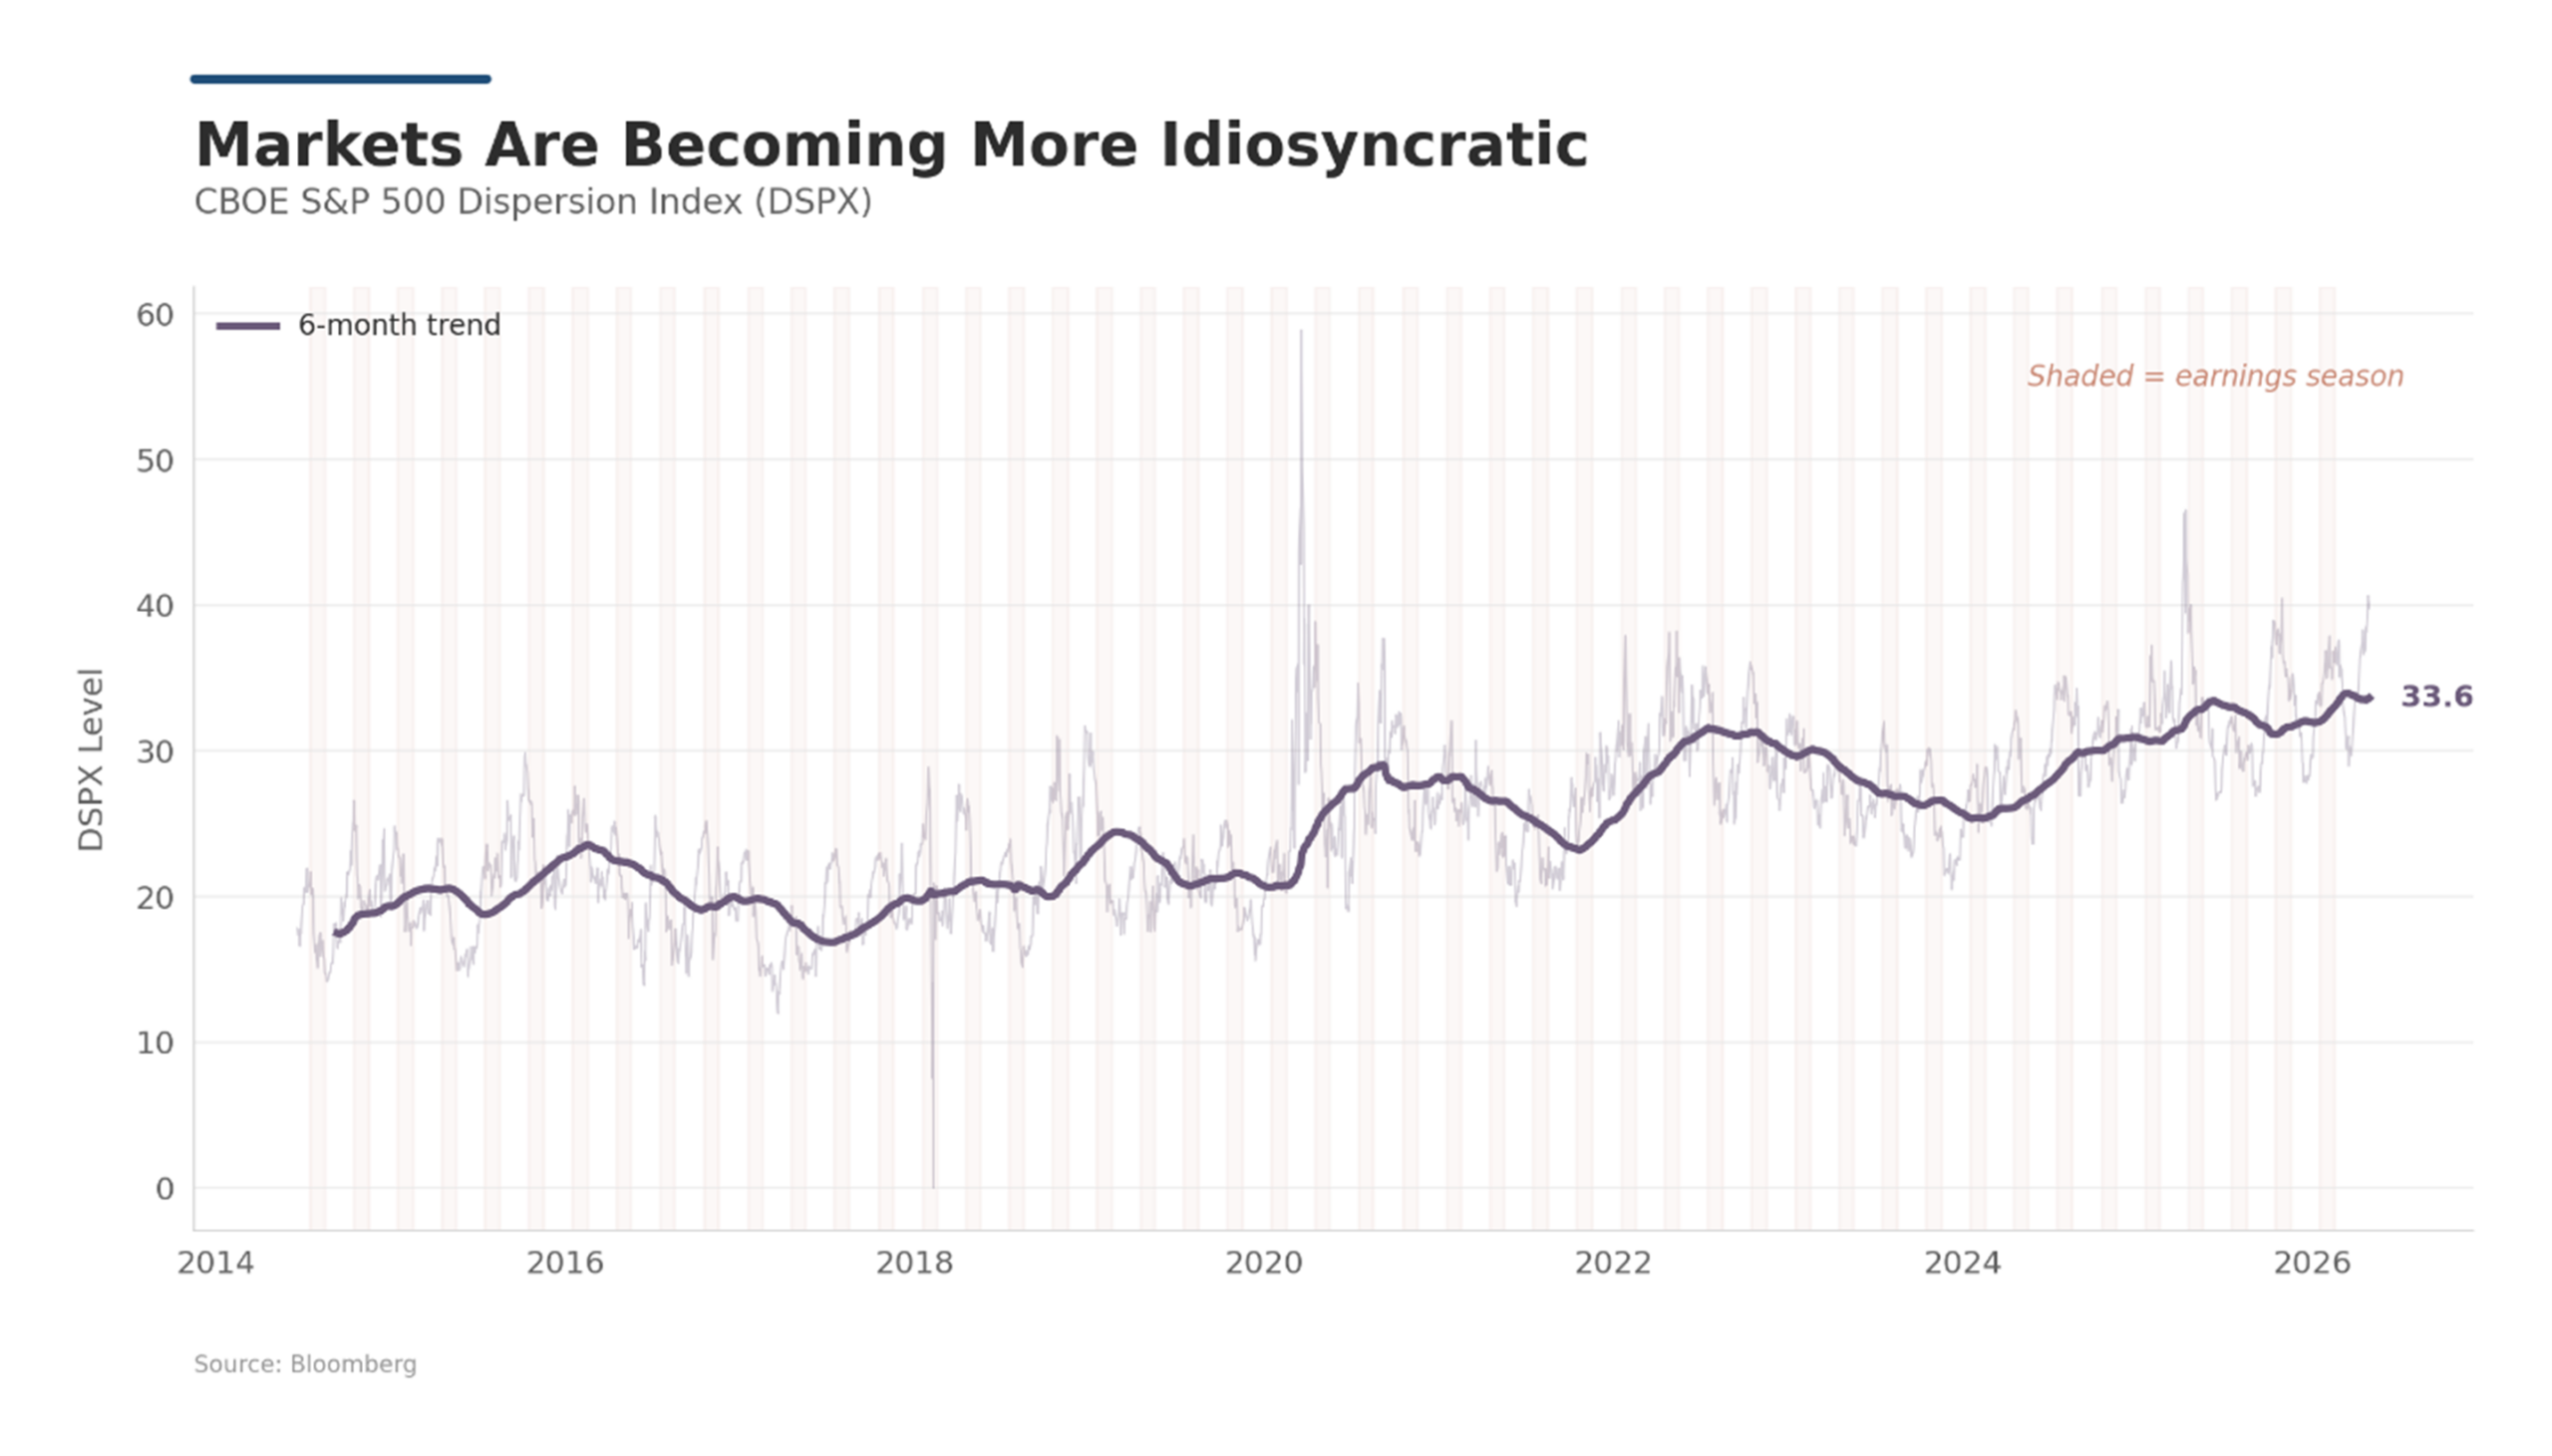
Dispersion among the constituents of the S&P 500 is rising. Part of this is mechanical: the index is heavily weighted toward technology, with a handful of mega-cap firms driving large idiosyncratic moves, particularly around earnings or key events. A single Nvidia, Meta, or Google earnings reaction can move the index meaningfully on its own: firm-specific, not market-wide.
The rise of investors who hedge out market and factor exposures in long-short equity portfolios — multi-strategy hedge funds in particular — also contributes to higher dispersion. Overlapping holdings and crowded positioning can trigger episodic deleveraging and cascades, producing sharp rotations within the index while aggregate index returns remain relatively calm.
The CBOE S&P 500 Dispersion Index (DSPX) has drifted from the high teens in 2014-2018 to the low 30s today (see Figure 6), with visible spikes during earnings season. The regime shift is in how equity risk is expressed: less at the index level, more in the cross-section.
‘Buy-the-Dip’ Psychology
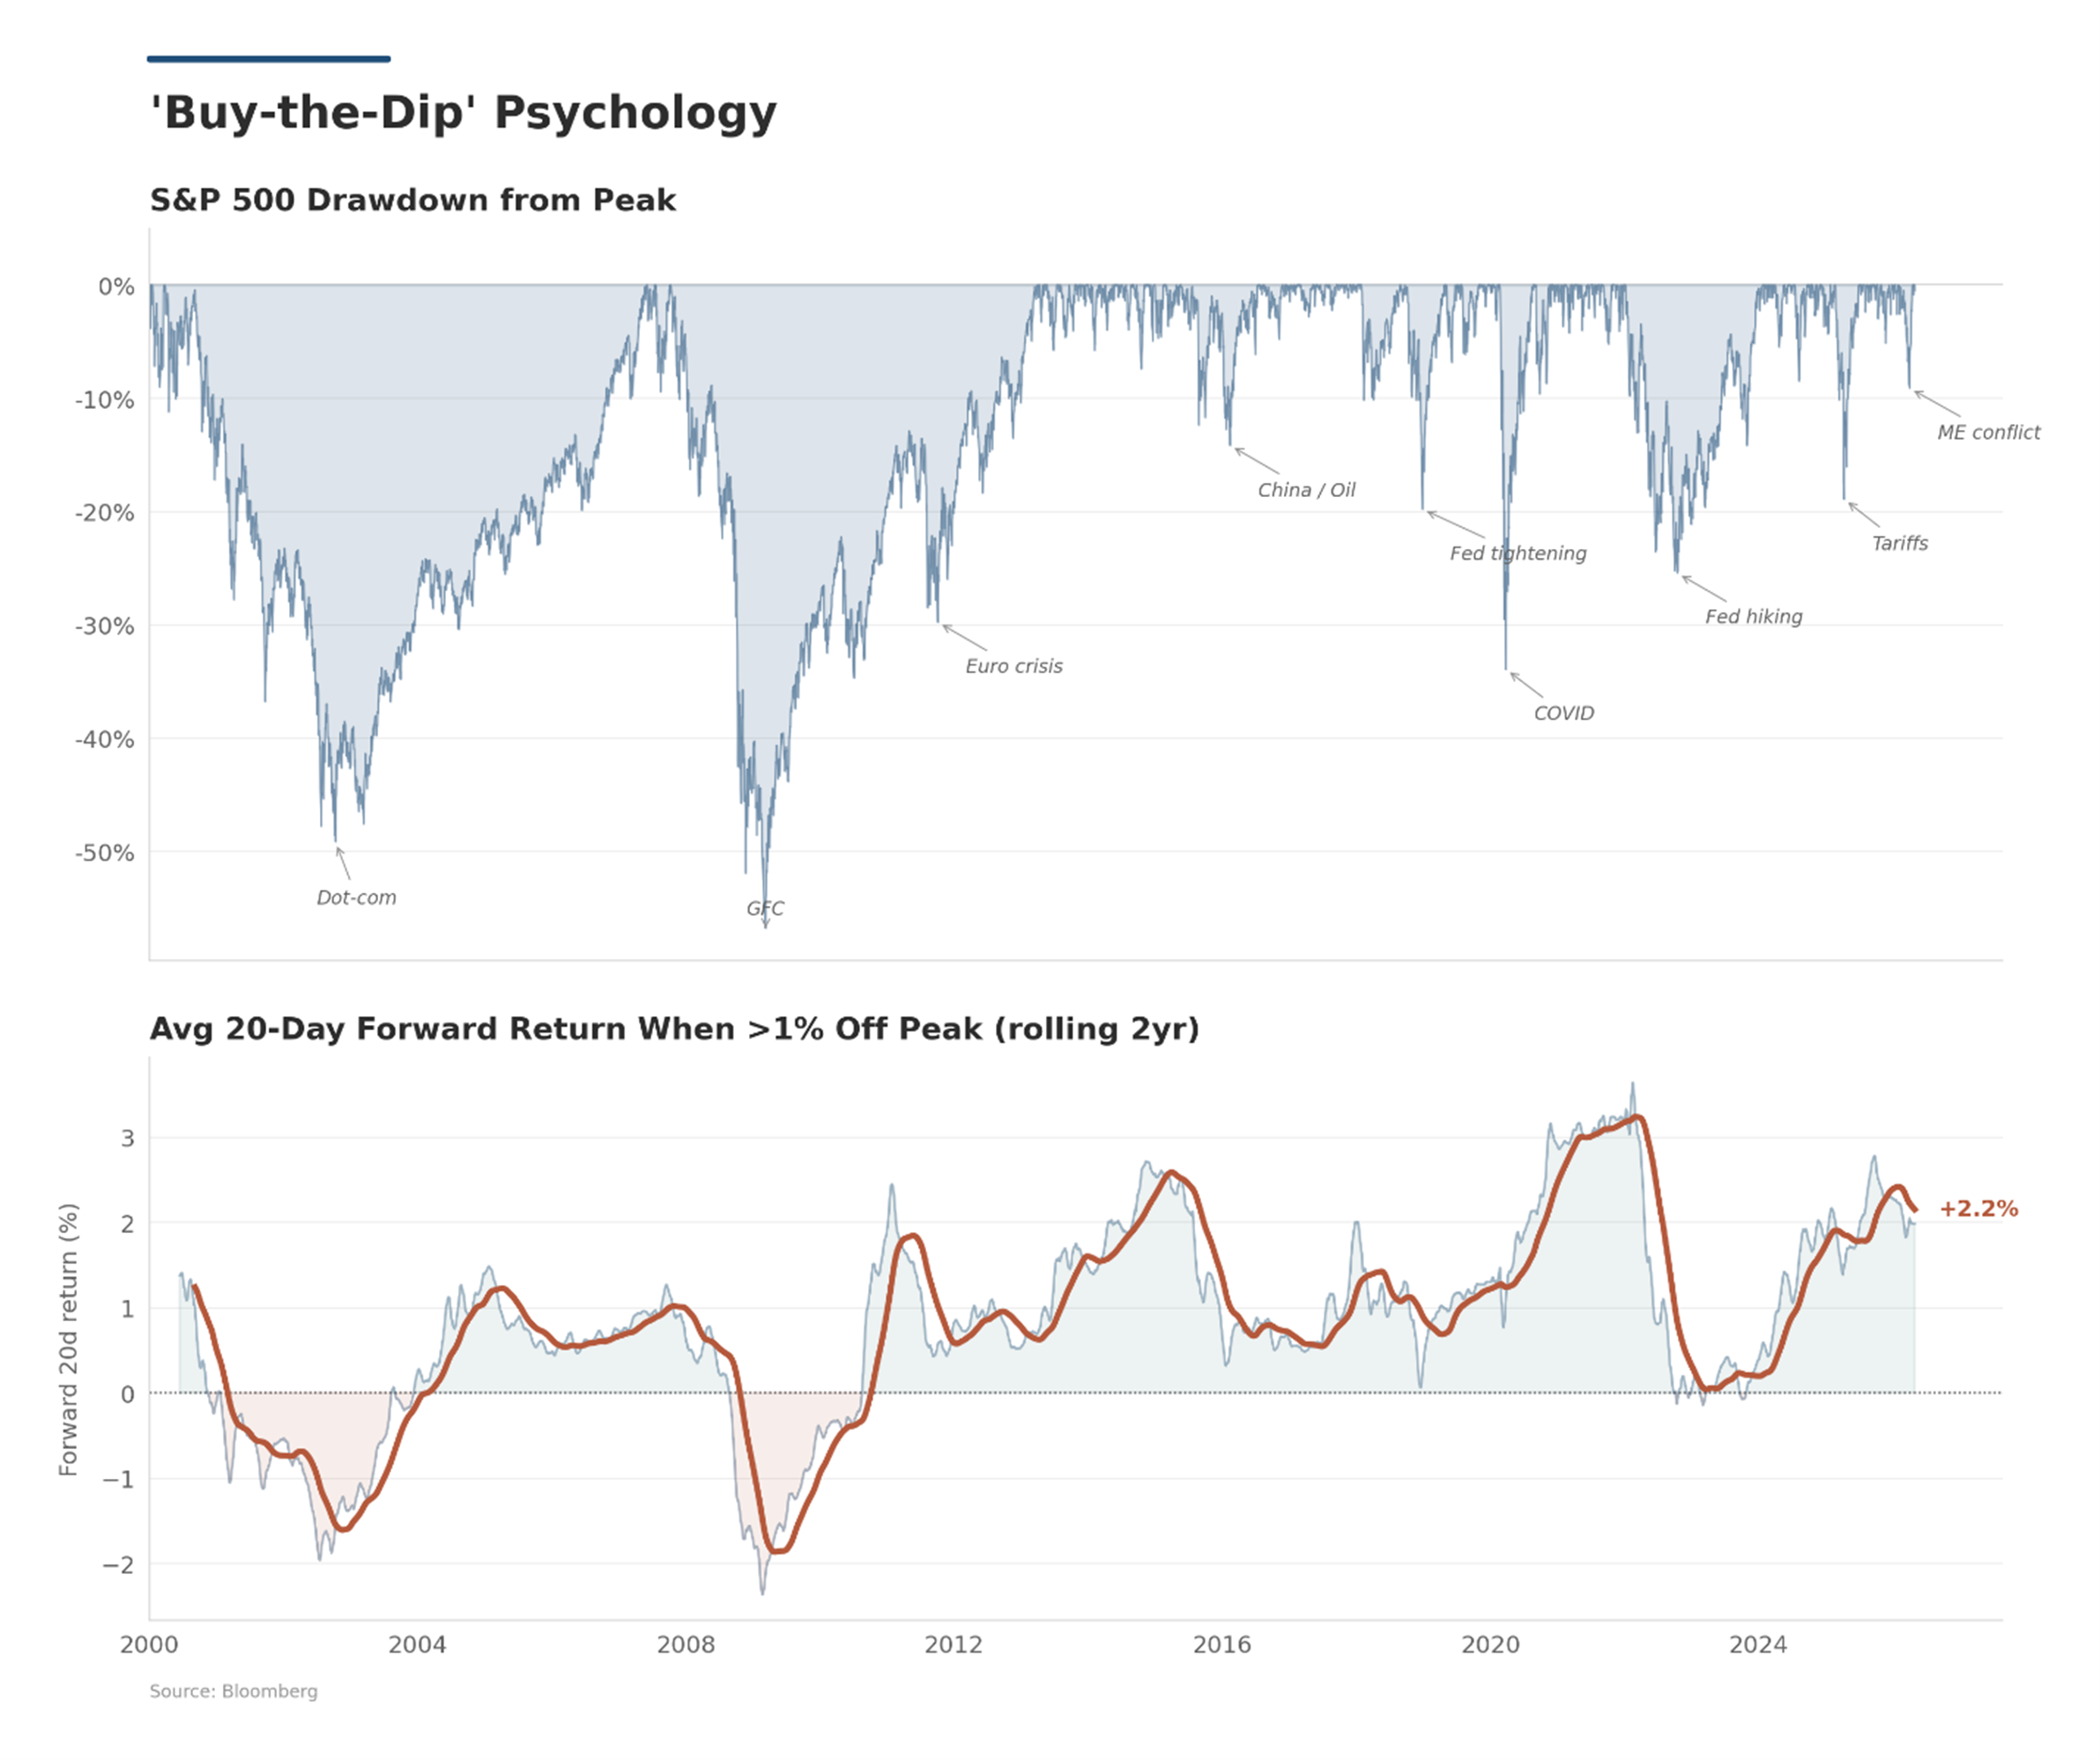
Like Pavlov’s dogs, investors — both discretionary and systematic — identify patterns in the market that shape their behavior. When animal spirits are running high and risk assets are performing well, investors rapidly buy into pullbacks in anticipation of mean-reversion gains. The performance of this strategy ebbs and flows over time as market participants compete the returns away. The current environment is one where market gaps are filled quickly, a signal of investor exuberance.
Figure 7 makes the regime visible. Since 2012, the average 20-day forward return following a >1% drawdown has been consistently positive — currently +2.2% — a stark contrast to the 2000-2010 period, when dip-buying was a losing strategy. The faster gaps are filled, the more the behavior is reinforced.
Implications for Systematic Strategies
It is a golden age for systematic investing — for firms that have built deep expertise and made the large investments in data and technology required to scale investment processes. The explosion in data alone is a rich hunting ground for new uncorrelated alphas. The world is estimated to create 221 zettabytes of data in 20265, and only firms with world-class infrastructure and research capabilities will be able to exploit it at scale.
The seven features above are not independent. Easy liquidity enables speculation. Democratized access channels new participants into an ever-expanding menu of financial innovations. These innovations leave traces in market prices. Multi-strategy crowding dampens index volatility relative to the cross-section. And the psychology of reflexive ‘dip-buying’ reinforces learned behaviors, whether the learner is a model or a human.
Whether opportunities arise from long-standing structural features of markets or from emergent patterns in today’s microstructure, systematic strategies are well positioned to benefit — provided the research process, data, and technology all ‘sync’ to scale with markets as they change.
1 “https://www.gsma.com/solutions-and-impact/connectivity-for-good/mobile-economy/”>https://www.gsma.com/solutions-and-impact/connectivity-for-good/mobile-economy/
2 “https://papers.ssrn.com/sol3/papers.cfm?abstract_id=4188052”>https://papers.ssrn.com/sol3/papers.cfm?abstract_id=4188052
3 As of May 11th, 2026
4 0DTE = options expiring same day. Dealers who are net short gamma (often the case as retail buys these contracts) must hedge by buying into rallies and selling into selloffs, amplifying intraday moves. The effect scales with the size of the gamma exposure, which has grown materially as 0DTE volumes have exploded.
5 1 billion terabytes. Source: IDC Global DataSphere Forecast.
Disclaimer:
Any statements regarding market events, future events or other similar statements constitute only subjective views, are based upon expectations or beliefs, involve inherent risks and uncertainties and should therefore not be relied on. Future evidence and actual results could differ materially from those set forth, contemplated by or underlying these statements. In light of these risks and uncertainties, there can be no assurance that these statements are or will prove to be accurate or complete in any way. All opinions and estimates included in this document constitute judgments of CFM as at the date of this document and are subject to change without notice. CFM accepts no liability for any inaccurate, incomplete or omitted information of any kind or any losses caused by using this information. CFM does not give any representation or warranty as to the reliability or accuracy of the information contained in this document. The information provided in this document is general information only and does not constitute investment or other advice. The content of this document does not constitute an offer or solicitation to subscribe for any security or interest.