Review of 2025 & Expectations for 2026: The Good, The Bad and The Ugly
Summary
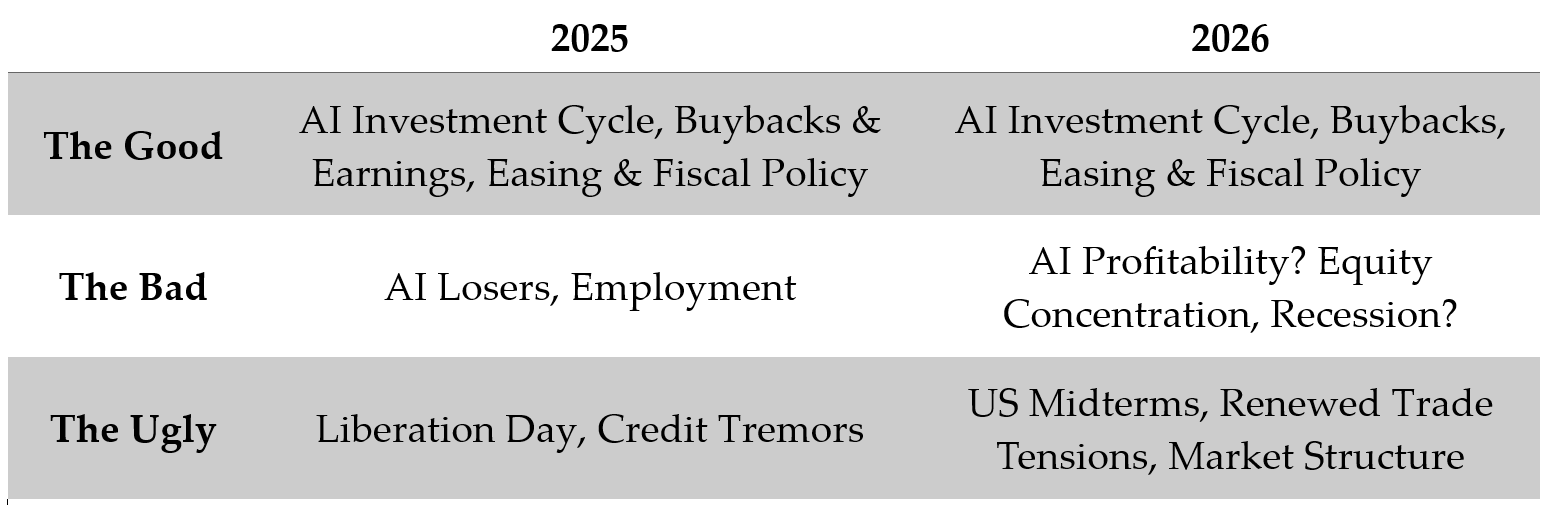
As year-end approaches we review what transpired in markets over 2025, highlighting “The Good, The Bad & The Ugly”. Sticking with our Sergio Leone inspiration, we do a similar exercise for 2026. For readers, we provide a short recap of 2025 and expectations into 2026 followed by an in-depth discussion.
Overview 2025
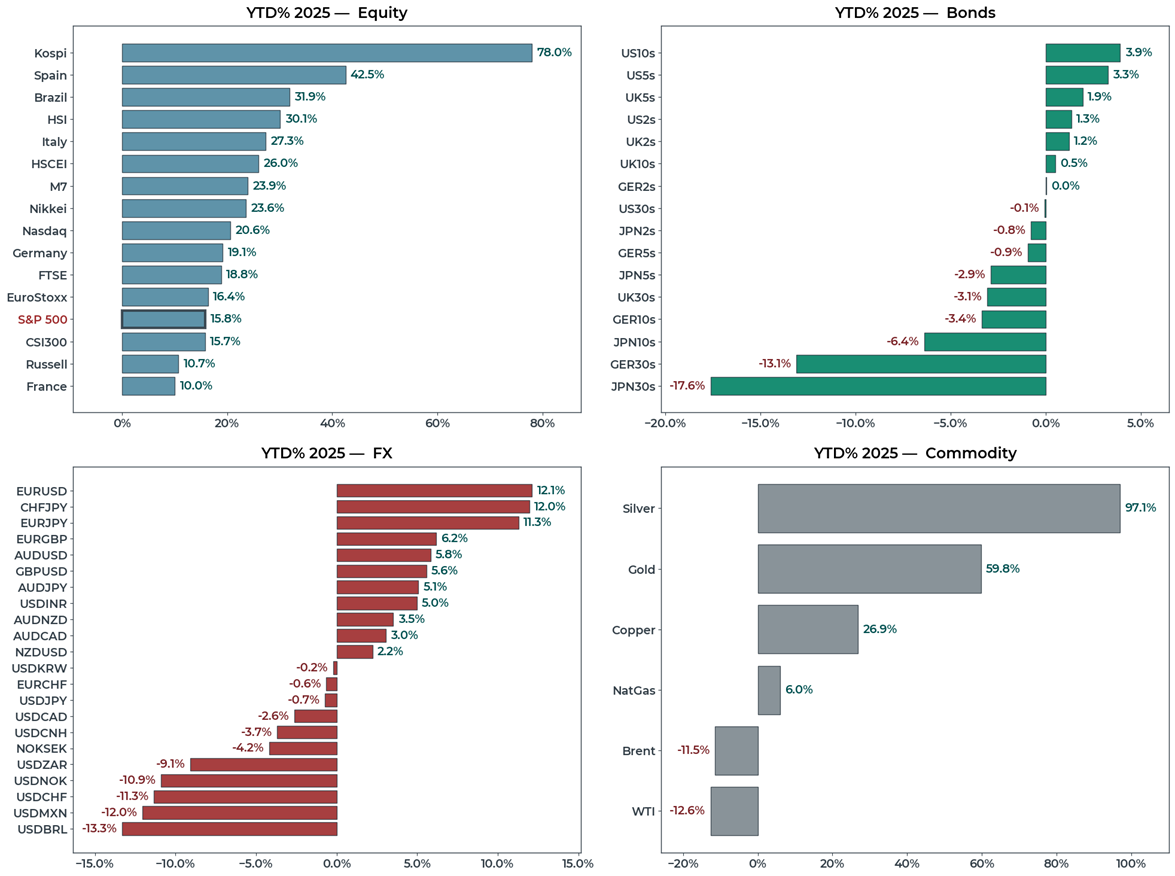
“The Good” heavily outweighed “The Bad” and “The Ugly” in 2025. Equity investors were handsomely rewarded as the AI investment cycle, buybacks, strong earnings, global easing and fiscal stimulus supported risk. Markets had a brief scare over US exceptionalism in response to the Liberation Day tariffs but where able to look through the event as the President walked back the threats and fundamentals remained strong. Non-US equities outperformed1 on cheaper valuations and idiosyncratic catalysts including fiscal expansion in Japan and Germany. China’s technology companies are emerging as credible competitors to Silicon Valley and a renewed push to increase domestic consumption in China benefitted domestic equities.
In rates, bonds had a volatile year. Outside the United States, new fiscal expansion in countries including Germany, Japan and the United Kingdom pushed long end yields higher with these bonds underperforming relative to the US. US bonds delivered gains in 2025 with yields declining over the year as the Federal Reserve officially started its easing cycle and jobs data was soft.
In currencies, the dollar was broadly weaker in 2025 as investors re-allocated capital to cheaper international markets and US yields compressed relative to international yields. High carry emerging market currencies were some of the best performers in 2025 benefitting from broad dollar weakness and favorable domestic conditions. Concerns around global fiscal expansion and policy uncertainty in the United States supported precious metals2 with investors seeking assets to protect purchasing power and to hedge against financial instability concerns. This included large purchases by global Central Banks including emerging markets3. Precious metals were one of the strongest performers in 2025.
In commodities, the oil complex was lower on the year as geopolitical tensions eased in the Middle East and the world was oversupplied with oil4. Copper is a key input into data center construction and benefitted from the AI theme.
Looking Into 2026
“The Good” still outweighs “The Bad” and “The Ugly” but that margin looks a lot tighter. We can expect the AI investment cycle to continue, benefiting firms that supply the buildout. In the United States, we have record announced buybacks6 and the Federal Reserve is priced to ease providing support to risk assets. The policies of the US Administration remain stimulative including tax cuts, the expensing of capital expenditures and de-regulatory efforts. We could also see an additional spending bill before the midterms.
“The Bad” starts with questions around AI profitability heading into 2026. Recent comments from OpenAI’s CFO71 about a government backstop8 for AI infrastructure and evasive answers from OpenAI’s CEO on a recent podcast9 on how OpenAI will fund the investments suggest profitability will be a key issue for 2026.
Equity market concentration remains an issue into 2026 with the overall direction of market capitalization weighted indices dictated by whether AI is a success or not. AI linkages extend globally to foreign equities, private markets and commodities. Investors should consider equity exposures and markets that offer cheaper valuations with a better risk balance heading into 2026.
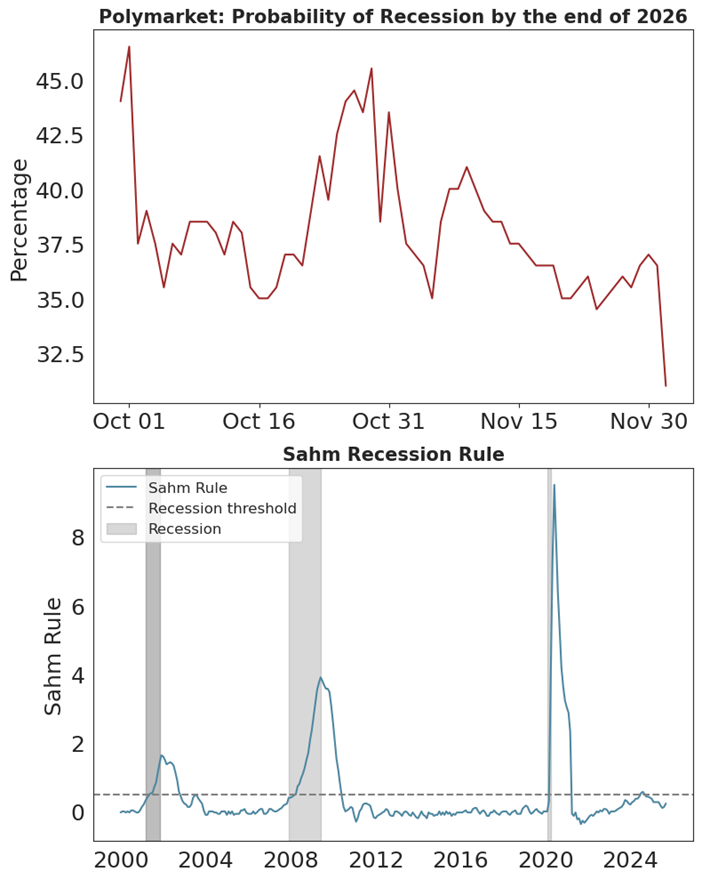
The New York Fed10 estimates a 25% probability of recession in 2026 and betting market odds are close to 35%11. The Treasury Secretary recently stated12 that he believes several sectors of the US economy are already in recession. Midterm elections happen in late 2026 and we can expect the Administration to run the economy hot. It will be interesting to watch how the growth and inflation mix transpires into 2026 with employment data softening and tariffs increasing costs for US households and corporates.
Finally, we have an unstable trade equilibrium with China and shifting market structure, where participants are shortening time frames and engaging in more speculative behavior. Investors should expect these risks to continue creating market volatility.
Where does this leave investors into 2026? Equities are at record highs, credit at record tights and a performing US economy with real growth around 2%, unemployment at 4.4% and inflation running around 3%. It will be tougher than 2025, investors should be considering equity like exposure away from AI heavy indices and strategies that add diversification. Precious metals are good candidates to hedge policy uncertainty and fiscal recklessness. Finally, bonds may prove to be diversifiers again in 2026, particularly if the United States slows down. Outright levels of yield are compelling versus alternatives including equities.
What Transpired in Markets during 2025?
THE GOOD 2025 – #1 AI Investment Cycle
The United States has entered its largest industrial investment cycle13 since WWII which is providing meaningful support to growth and equity valuations. The watershed moment was Google’s ‘Attention is All You Need’14 paper published in 2017 ushering-in the age of the Transformer, Generative AI and LLMs15. Several new businesses have been created to capitalize on this disruptive technology with an insatiable appetite to scale the technology. Generative AI is different from software16 and requires significant capex to deploy. Over 2025, the market rewarded AI and AI-adjacent themes which accounted for the majority of equity market performance. For example, since the launch of ChatGPT in November 2022, AI related stocks account for 75% of the S&P 500 return, 80% of earnings growth and 90% of capex17.
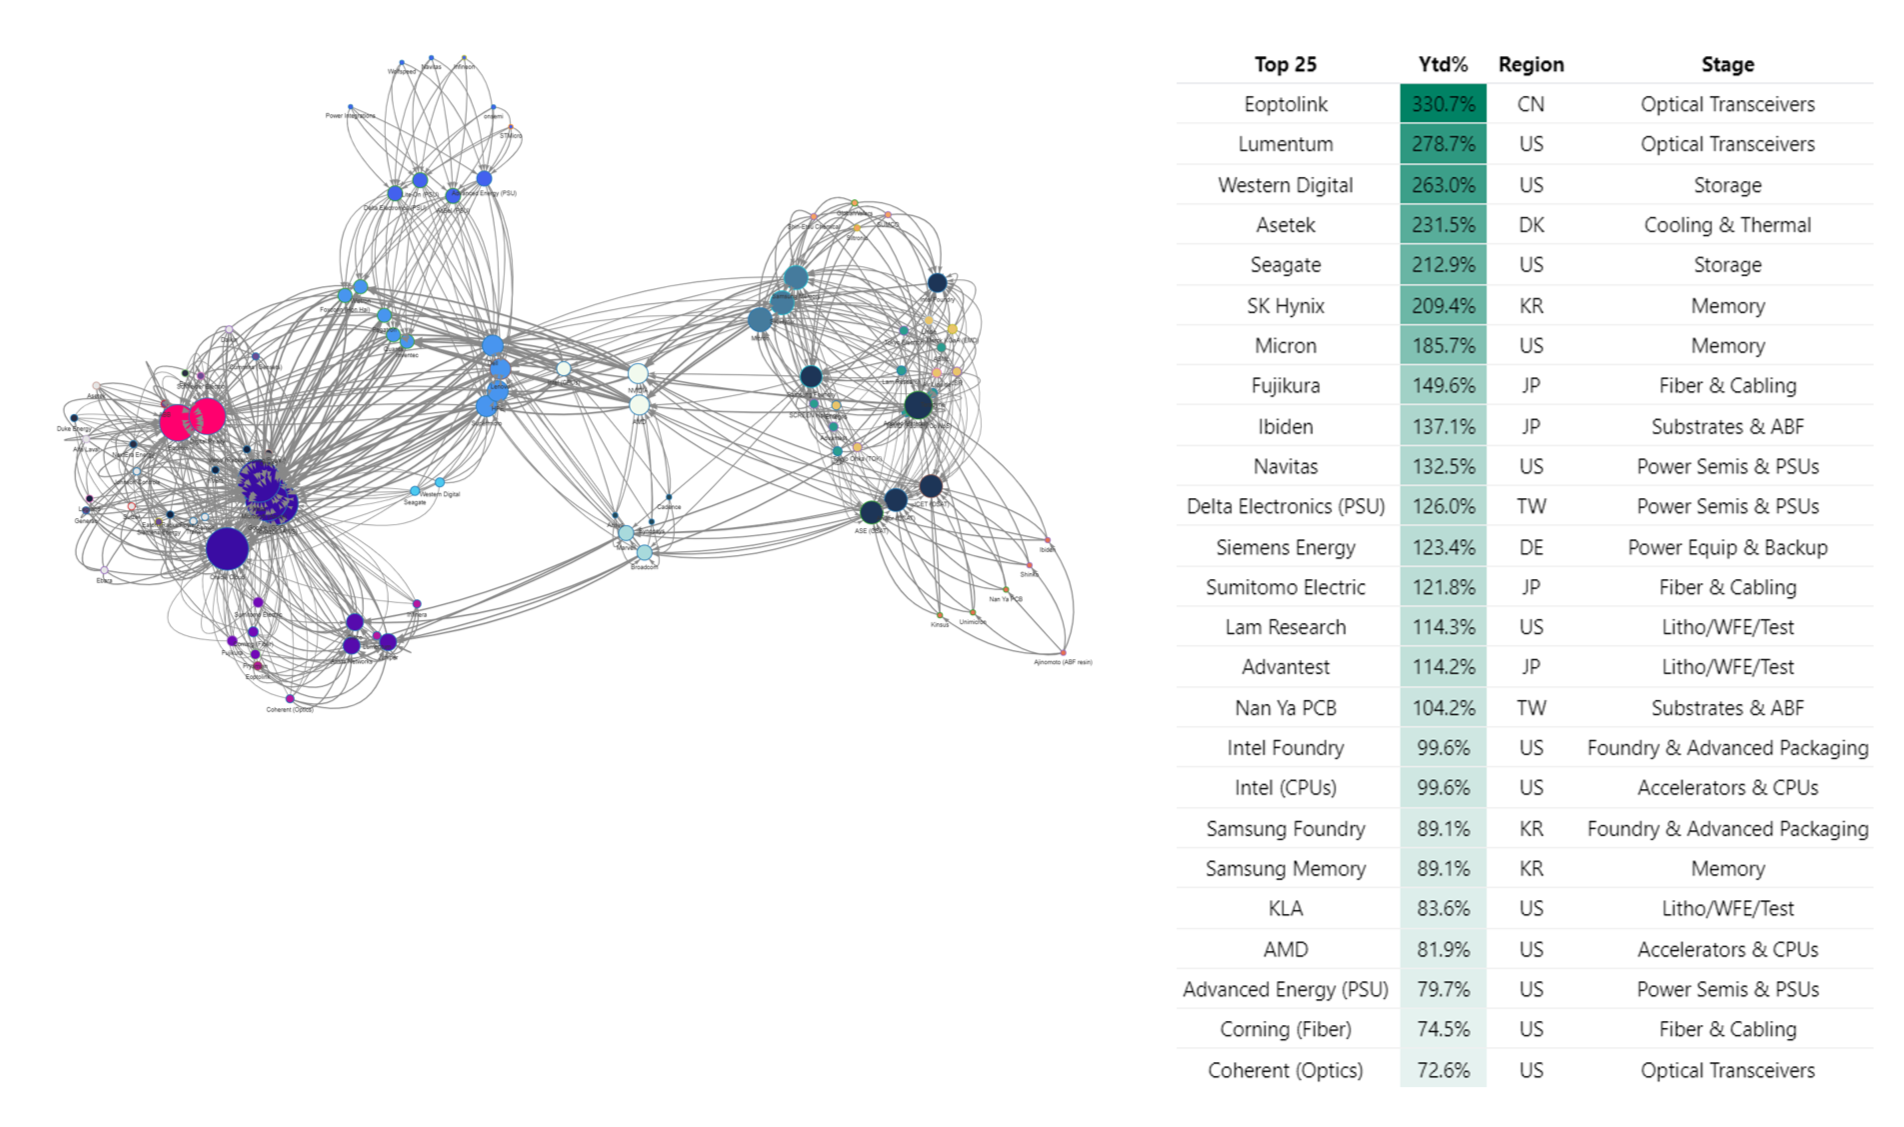
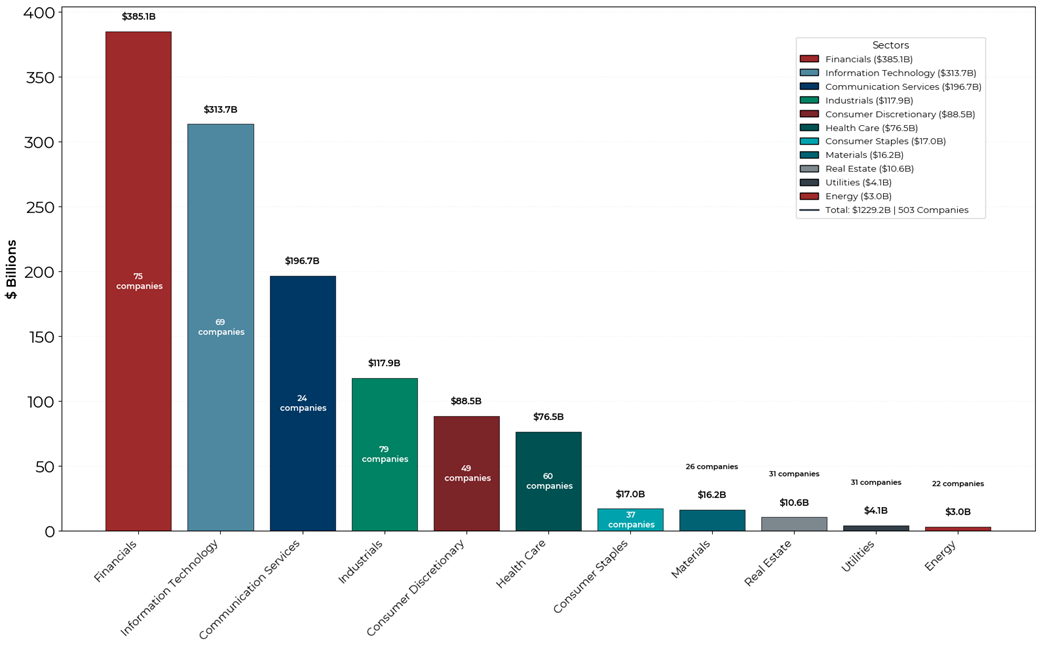
The AI theme is not isolated to the United States. The impact is global. If we look at the inputs that go into data center construction: racks, servers, cabling, batteries, transformers, natural gas generators, fire systems, memory, switches, cooling etc. many components require specialized manufacturing and are sourced globally. Nvidia estimates that all-in data center construction costs are approximately $50 million per megawatt18. OpenAI wants to deploy 250 gigawatts by 203319 or roughly $12.5 trillion in investment. Figure 2 shows 2025 capex spending of $350 billion at four of the large hyper-scalers. Investment in information processing equipment & software is 4% of GDP. But it was responsible for 92% of GDP growth in the first half of this year. GDP excluding these categories grew at a 0.1% annual rate in the first half20.
In addition to the US, equities linked to the build out in Europe, China, Taiwan, Korea and Japan have benefitted. In Figure 3 we show the linkages in demand and supply chains across 92 firms that are contributing to the AI buildout. We also show year-to-date performance for the top 25 names in the network. AI linked equities have outperformed.
THE GOOD 2025 – #2 Global Central Bank Easing Cycle
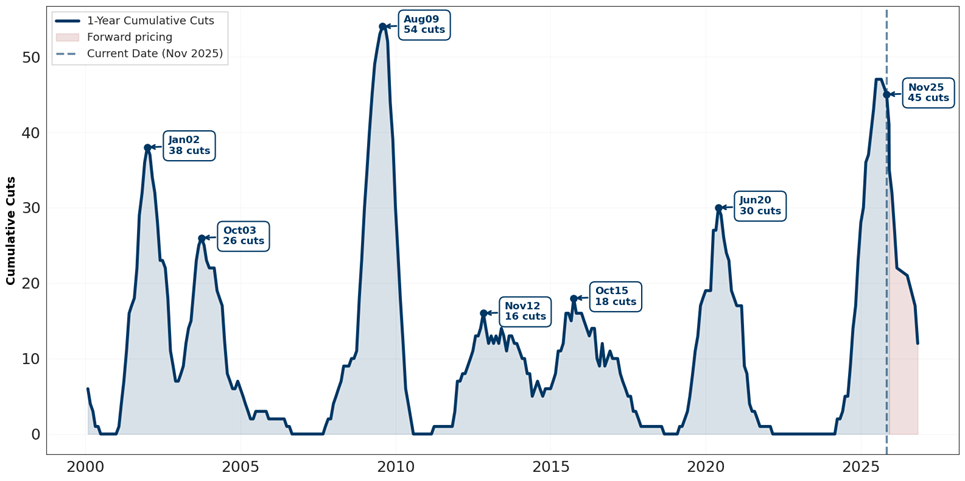
Global central banks cut rates aggressively over the last 24 months, not far from the amount of easing in the GFC21 and faster relative to the Federal Reserve which is now starting its easing cycle. In addition to cheaper valuations, faster relative easing helped non-US equities outperform in 2025 as shown in Figure 1.
THE GOOD 2025 – #3 Buybacks & Earnings
Stock buybacks in 2025 totaled close to one trillion providing a tailwind to US equities. This equates to roughly $6 billion per day22 in buying support outside of earnings blackout periods.
Corporate earnings in 2025 were strong, Goldman Sachs estimates that 64% of reporting companies in the S&P500 beat consensus earnings-per-share by one standard deviation, a 25-year record ex the Covid re-opening. However, the technology sector contributed the majority of earnings outperformance at index level given its size in the index.
THE GOOD 2025 – #4 Global Fiscal Stimulus
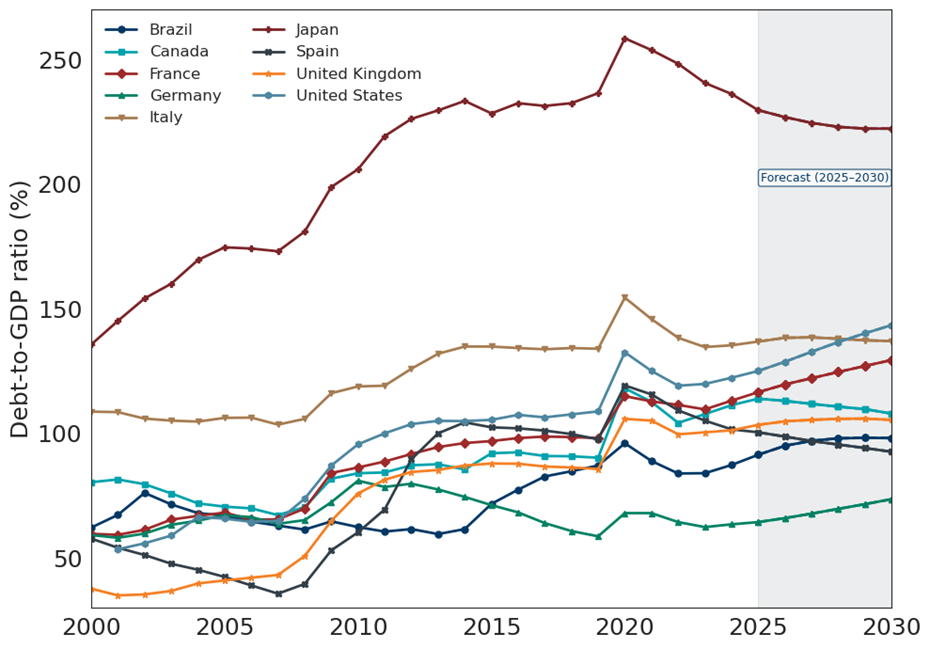
The fiscal playbook pioneered by the United States during the President’s first term and continued in the second has been copied by several countries. For example, the United Kingdom, France, Germany23, Japan and Canada are all looking at opening the fiscal gates. Politicians argue fiscal expansion works by growing the economy faster than the cost of debt which de-leverages an economy’s balance sheet over time. It remains unclear whether this policy mix will be successful. Countries with lower overall debt burdens like Germany have better odds or AI might deliver large productivity gains allowing economies to grow and de-leverage simultaneously. In the short term, fiscal expansion and de-regulation efforts benefit equities and increase yields, a dynamic playing out in Germany and Japan where newly elected leaders commit to expansionary fiscal policies.
THE BAD 2025 – #1 AI Losers
Markets quickly repriced the equity of firms facing competitive pressure from LLMs. Business models tied to repetitive tasks and high automation potential are at risk. The list of sectors facing disruption is long and includes legal services, software development, customer service and call centers, content creation and media, education, healthcare administration, marketing and advertising, financial services, translation and localization, human resources, research and consulting, creative industries and the government and public sectors. An index of names exposed to AI risks24 was down 33% in 2025. LLMs are a disruptive general purpose technology and can rapidly erode competitive moats. Investors need to stay vigilant.
THE BAD 2025 – #2 Employment
Statistical data in the United States is getting sparse with the Government shutdown and downsizing of Government agencies25. The Administration is also enacting new high impact policies that are increasing economic uncertainty. Jobs data in the US softened in 2025 and is a key economic variable to watch into 2026. In addition to large Government job cuts, employment weakness is also explained by corporates implementing hiring & firing freezes as they assess AI and its impact on productivity and margins26.
THE UGLY 2025 – #1 Liberation Day Tariffs
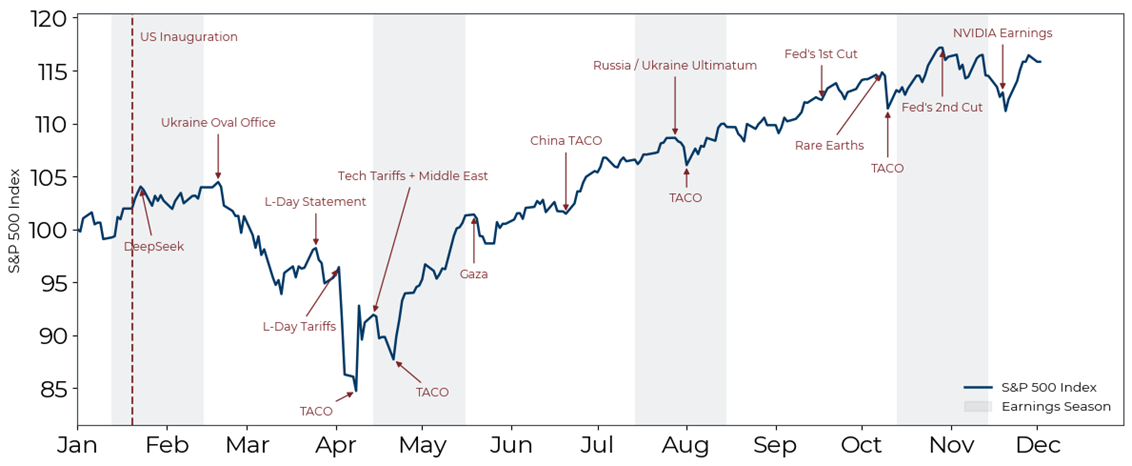
President Trump’s liberation day announcement caught the market offside. Tariff rates came higher and broader than expected, triggering risk-off price action and large position reduction. The President and his inner circle call it ‘maximizing strategic uncertainty’ or the use of initial, aggressive demands in negotiations then walking the terms back when unfavorable reactions manifest. The rapid escalations and walk backs on unpredictable time scales made volatility forecasting more challenging in 2025. Markets briefly entertained the end of US exceptionalism in response to the Liberation Day tariffs but ultimately looked through the event as the President strategically walked back his threats while fundamentals remained strong over 2025.
THE UGLY 2025 – #2 Credit Tremors
With credit spreads at record tights, we are seeing pockets of late cycle behavior and questionable underwriting standards. So far, the problems appear isolated to private credit27 and a common theme of illegally re-pledging collateral. Underwriters are rushing to ensure collateral is actually pledged against loans and we could see more issues emerge in the coming months.
Looking Forward to 2026
THE GOOD 2026 – #1 Easing
The Federal Reserve is priced to cut more aggressively than peers. Roughly 3.6 cuts28 are priced through the end of 2026 which would take the Federal Funds rate closer to 300bps, a support to risk assets and a negative for the dollar. The composition of the FOMC is also changing as the Administration replaces Governors with dovish picks, including the incoming Chairman in May 2026. The Federal Reserve is also stopping its balance sheet runoff in part because reserves in the financial system have fallen below levels considered ‘ample’ exacerbating pressures in the funding market and de-anchoring the overnight rate. Halting quantitative tightening is easing.
The easing is happening with equities at record highs, credit at record tights and a performing economy with real growth around 2%, unemployment at 4% and inflation running around 3%. Broadly, this is a positive tailwind for global risk assets. As shown in Figure 4, our basket of central banks is priced for 17 cuts over 2026, lower than the number of cuts realized over the last year, suggesting relatively less easing for 2026.
THE GOOD 2026 – #2 Buybacks
Announced buybacks for 2026 exceed one trillion and will continue to support demand for US equities into 202629. Investors should watch free cashflow at the hyper scalers, the AI buildout burns cash resources and could reduce the size of buybacks. Morgan Stanley estimates that $1.4 trillion of the required $2.9 trillion data center capex spend thru 2028 will come from technology companies. The balance will be funded with private credit, corporate bonds, securitizations, private equity and creative financial engineering30.
THE GOOD 2026 – #3 AI Investment Cycle
The hyper scalers forecast capital expenditure increases for 2026, and we are still in the early stages31 of the data center buildout. Spending will continue and suppliers to the buildout are well placed to benefit, but evidence of use cases and a path to profitability will be key for firms building on the application level. Another potential headwind to profitability is inflation in key data center inputs as suppliers raise prices32 in response to excess demand.
THE GOOD 2026 – #4 US Policy
It has been less than a year since the new Administration was inaugurated. The Republicans passed one large spending bill, and we can expect this stimulus including tax cuts, expensing of capex and de-regulatory efforts to support the economy into 2026. It is also possible the Republicans pass another spending bill before the midterms, adding further stimulus to the economy. The policy approach is to run the economy hot into the midterms.
THE BAD 2026 – #1 AI Profitability
OpenAI is reported to lose $3 for every $1 of revenue33. Although OpenAI has a first mover advantage with 800 million active users, questions remain on how they will fund aggressive expansion plans, both to increase computation and develop devices and applications to use the technology. Organic growth is insufficient to fund investments and will require a combination of cash flow, debt, venture capital and creative financial engineering.
Third quarter earnings showed that markets still require a path to profitability on AI investment. Meta and Google both increased capex but Meta missed on top line while Google beat. Meta’s stock declined 11% and Google rallied 5%34. Earnings season will be more treacherous in 2026. If the market continues to discount lofty AI valuations, earnings misses will be punished and weaken the AI theme.
THE BAD 2026 – #2 Concentration
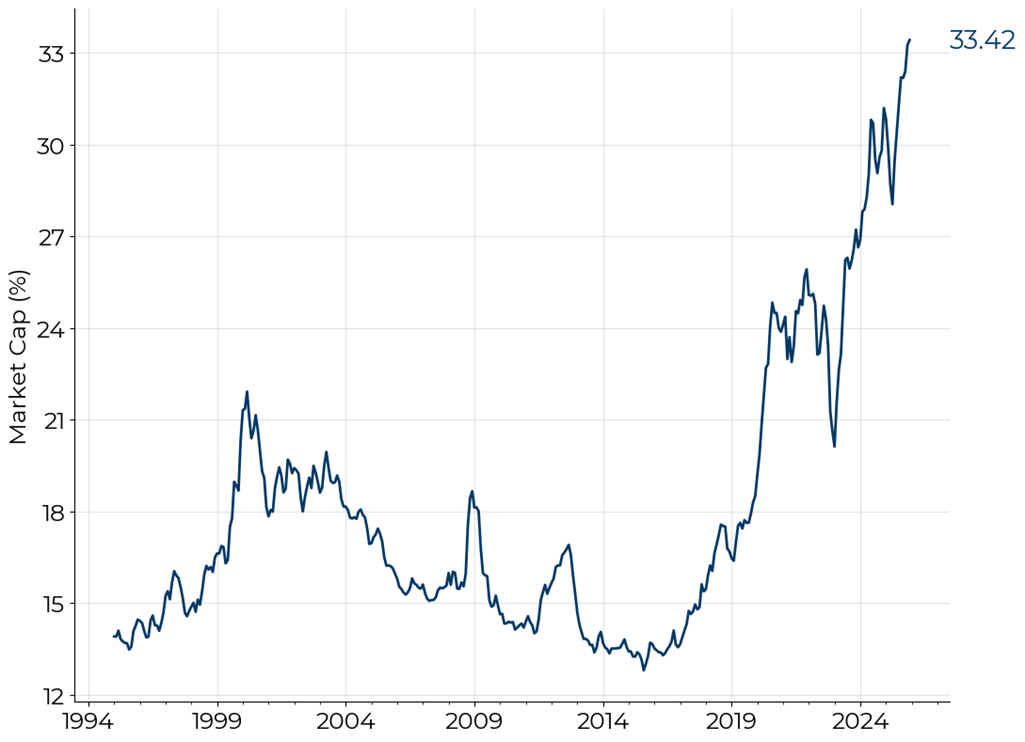
The performance of the S&P500 is narrow and closely tied to the performance of the hyper scalers. Figure 10 shows the contribution to market capitalization for the top 7 names in the S&P50035. We also show the world’s most valuable36 company, Nvidia in Figure 11. Nvidia accounts for over 8% of the S&P500 market capitalization, 22% of its volatility and a significant percentage of index dispersion, particularly on news heavy days including earnings. Ownership of US equities is a macro bet AI will be profitable and as we discussed above, the theme is global – commodities, foreign equities and infrastructure are vulnerable to shifts in investor perception.
Owning the hyper scalers has been an incredible investment for decades and is under pinned by fundamentals. The valuation expansion is primarily the result of earnings coming-in higher than discounted as the hyper scalers reaped the benefits of asset light businesses like software where marginal costs approach zero. Generative AI is different, as it requires material capital expenditure and may not exhibit the same scaling properties as software.
THE BAD 2026 – #3 Recession
Triangulating economic pressures has been more difficult given the speed and uncertain impact of the Administration’s policies. Reductions in the size of Government via the DOGE37 and the shutdown hurt the quality of official data. Non-official labor market indicators including the Challenger jobs survey38 suggest additional labor market weakness in the United States.
Betting markets price the odds of a US recession by the end of 2026 at 32%39 and during a recent interview, the Treasury Secretary said40 that he believes several sectors are already in recession. Indeed, excluding the healthcare sector, payroll growth has been flat or negative in the last three payroll reports. AI is also playing a key role in labor market weakness, firms either believe AI will lead to large productivity gains reducing demand for labor or are using the narrative as cover to reduce bloated headcounts. We also show the Sahm rule which has a reasonable track record of predicting recessions. The measure is drifting higher towards the threshold but suggests a recession in the US is not imminent.
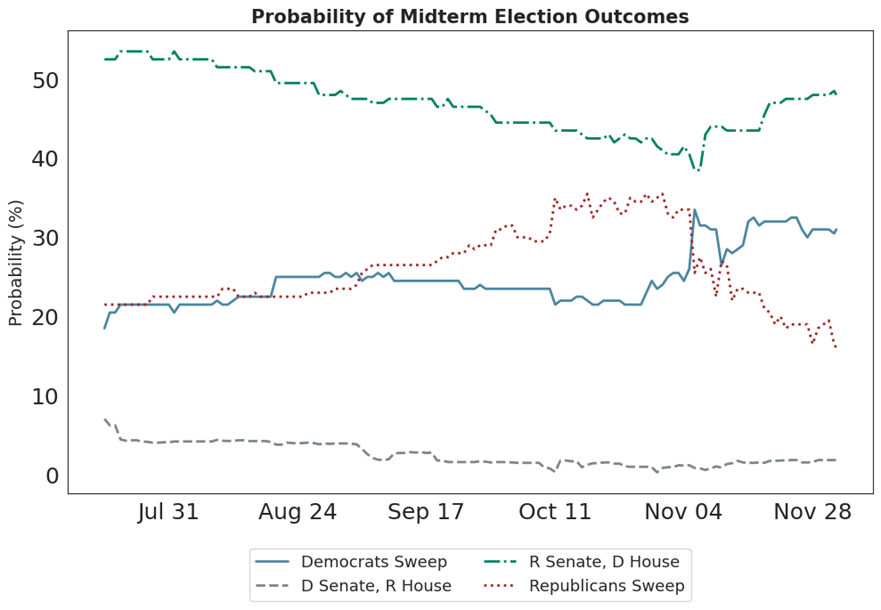
THE UGLY 2026 – #1 US Midterms
The President and his Administration will look to preserve the thin majority they hold in Congress. Midterm elections happen in November 2026 and prediction markets41 show a 76% chance the Democrats win the House and a 66% chance the Republicans win the Senate. Odds of a Democrat sweep are 30%, a Republican sweep is priced at 20%. The Administration needs economic growth, lower inflation, rising employment and strong equity market valuations over 2026 to increase the odds of winning. Investors should expect the Administration to create favorable conditions for these variables. They should also expect a heated, potentially contentious election as the stakes remain high and the ideological divide between the two parties remains wide.
THE UGLY 2026 – #2 Renewed Trade Tensions
The President and Treasury Secretary secured a one-year trade pause42 with China at the APEC meeting in South Korea. The equilibrium is fragile with escalation lurking as a 2026 risk43 for markets. The President has shown he is sensitive to stock market prices and counterparties that hold leverage over the United States. We can expect trade driven market volatility to continue in 2026.
THE UGLY 2026 – #3 Market Structure
Speculative elements of the market are rising and it has never been easier for global investors to invest and trade as a result of technology. Participation of retail investors is high and there has been a proliferation of leveraged instruments both linear and non-linear to cater to speculative demand. The shorter holding periods of these flows, sensitivity to losses and ability to trade immediately on devices can amplify market volatility.
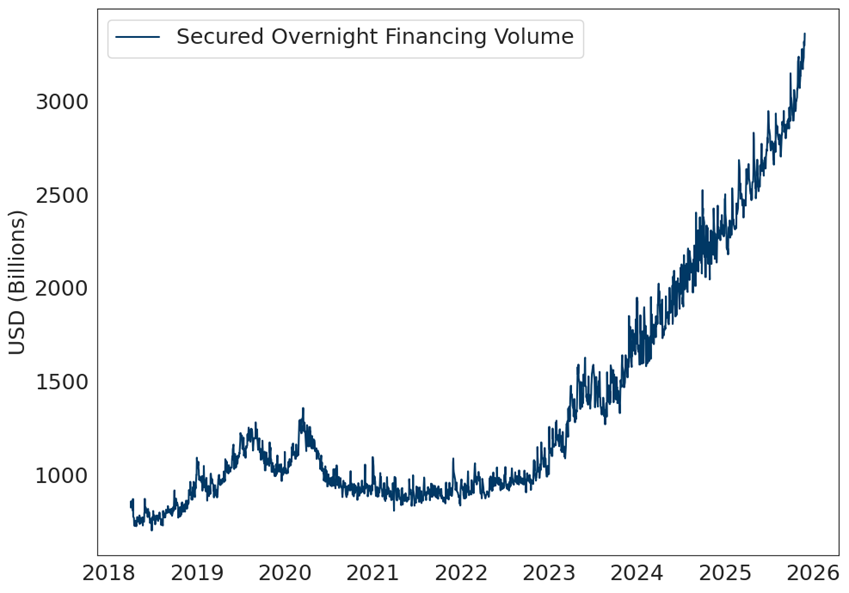
Finally, record Government debt issuance requires private sector buying to clear the market. Leveraged investors, including hedge funds, play an important demand role via the bond futures basis. This is a form of liquidity provision where hedge funds typically sell rich futures and buy cheap bonds to capture the spread. The bonds are leveraged by borrowing in repo markets. Demand for repo has risen44 steadily as Governments continue to increase borrowing. Given the high leverage in the strategy, stress in funding markets is a primary risk and can spill over to other strategies when large, diversified managers decide to cut overall portfolio risks. This type of cascading risk reduction is a form of crowding and remains a risk for investors.
1 Unhedged US domiciled investors benefitted from a weaker dollar and larger total returns, foreign unhedged investors in US assets did not.
2 See our piece: https://www.cfm.com/forged-in-a-cosmic-furnace/
3 https://www.bloomberg.com/news/newsletters/2025-10-16/central-banks-worrywarts-and-shoppers-drive-gold-s-rally
4 https://www.bloomberg.com/news/articles/2025-10-27/oil-at-sea-soars-to-fresh-record-in-further-sign-of-oversupply
5 Equity returns are denominated in local currency, excluding dividends. FX returns are spot returns.
6 https://www.visualcapitalist.com/biggest-stock-buybacks-of-2025/
7 https://www.reuters.com/business/openai-does-not-want-government-guarantees-massive-ai-data-center-buildout-ceo-2025-11-06/
8 https://www.cnbc.com/2025/11/06/trump-ai-sacks-federal-bailout-openai-friar.html
9 https://www.youtube.com/watch?v=Gnl833wXRz0
10 https://www.newyorkfed.org/medialibrary/media/research/capital_markets/prob_rec.pdf
11 Polymarket
12 https://www.youtube.com/watch?v=XrsFYJvsWp4
13 US Census Bureau. Manufacturing construction spending.
14 https://arxiv.org/abs/1706.03762
15 Large language model
16 Asset light, intellectual property with hyper-scaling properties.
17 https://www.netinterest.co/p/bubble-trouble
18 https://www.cnbc.com/2025/09/22/nvidia-openai-data-center.html#:~:text=In%20August%2C%20Huang%20told%20investors,for%20Nvidia%20chips%20and%20systems
19 https://fortune.com/2025/10/11/openai-power-grid-emerald-ai/
20 https://x.com/jasonfurman/status/1971995367202775284
21 Global financial crisis
22 Source: Goldman Sachs
23 Military spending has a lower multiplier effect on the economy but has supported defense related sectors.
24 Source: CFM
25 Also see our paper ‘Penny wise, data foolish: funding cuts and revision errors at the BLS’
26 In many cases, these ‘AI-related efficiency gains’ are code for headcount reduction and margin improvement.
27 https://www.nb.com/en/global/insights/article-lessons-from-first-brands-and-tricolor
28 As of November 26th, 2025
29 https://www.visualcapitalist.com/biggest-stock-buybacks-of-2025/
30 https://www.bloomberg.com/news/features/2025-10-07/openai-s-nvidia-amd-deals-boost-1-trillion-ai-boom-with-circular-deals
31 https://openai.com/index/announcing-the-stargate-project/
32 https://www.ft.com/content/64e7dfb0-b32c-417e-b411-efc9098e1e3a
33 https://futurism.com/artificial-intelligence/openai-money-lost-quarter
34 October 29th, 2025
35 Nvidia, Apple, Microsoft, Amazon, Broadcom, Alphabet and Meta
36 $5.7 trillion as of November 6th, 2025
37 Department of Government Efficiency
38 https://www.ft.com/content/fabbdb77-14da-49bf-862e-3269ab9f9cb3
39 Polymarket, as of December 2nd, 2025.
40 https://www.youtube.com/watch?v=XrsFYJvsWp4
41 Polymarket. As of December 2nd, 2025.
42 Details and agreements remain to be negotiated.
43 https://www.brookings.edu/articles/what-happened-when-trump-met-xi/
44 https://fred.stlouisfed.org/series/SOFRVOL
Disclaimer:
Any statements regarding market events, future events or other similar statements constitute only subjective views, are based upon expectations or beliefs, involve inherent risks and uncertainties and should therefore not be relied on. Future evidence and actual results could differ materially from those set forth, contemplated by or underlying these statements. In light of these risks and uncertainties, there can be no assurance that these statements are or will prove to be accurate or complete in any way. All opinions and estimates included in this document constitute judgments of CFM as at the date of this document and are subject to change without notice. CFM accepts no liability for any inaccurate, incomplete or omitted information of any kind or any losses caused by using this information. CFM does not give any representation or warranty as to the reliability or accuracy of the information contained in this document. The information provided in this document is general information only and does not constitute investment or other advice. The content of this document does not constitute an offer or solicitation to subscribe for any security or interest.
The S&P500 and associated data are a product of S&P Dow Jones Indices LLC, its affiliates and/or their licensors and has been licensed for use by CFM. © 2025 S&P Dow Jones Indices LLC, its affiliates and/or their licensors. All rights reserved. Redistribution or reproduction in whole or in part are prohibited without written permission of S&P Dow Jones Indices LLC. For more information on any of S&P Dow Jones Indices LLC’s indices please visit www.spdji.com. S&P® is a registered trademark of Standard & Poor’s Financial Services LLC (“SPFS”) and Dow Jones® is a registered trademark of Dow Jones Trademark Holdings LLC (“Dow Jones”). Neither S&P Dow Jones Indices LLC, SPFS, Dow Jones, their affiliates nor their licensors (“S&P DJI”) make any representation or warranty, express or implied, as to the ability of any index to accurately represent the asset class or market sector that it purports to represent and S&P DJI shall have no liability for any errors, omissions, or interruptions of any index or the data included therein.