“Post Midterm Rally”? Terms and conditions apply
This article is general commentary on historical data.
“Post Midterm Rally”? Terms and conditions apply
The financial commentary around the midterms has a recurring theme pointing to the post-midterm S&P 500 outperformance. One version of the claim looks particularly solid: In the nine months after every US midterm since the Second World War, the S&P 500 has finished higher than it was on election day. The usual explanations include relief that the uncertainty is over, the comfort of gridlock and a lift for policy-sensitive sectors.
If we give someone a coin that lands heads about two times in three and ask them to flip it 20 times, in an event of all flips coming up heads, we would be entitled to some suspicion, and some curiosity about whether they practiced beforehand.
That is roughly our position when we look at the postwar stock market around midterm elections. Ordinary nine-month stretches end higher about 69 percent of the time. The nine months after each of the 20 midterms since 1946 all did.
The suspicion turns out to be justified, though not for the reasons people usually give.
A high bar, cleared
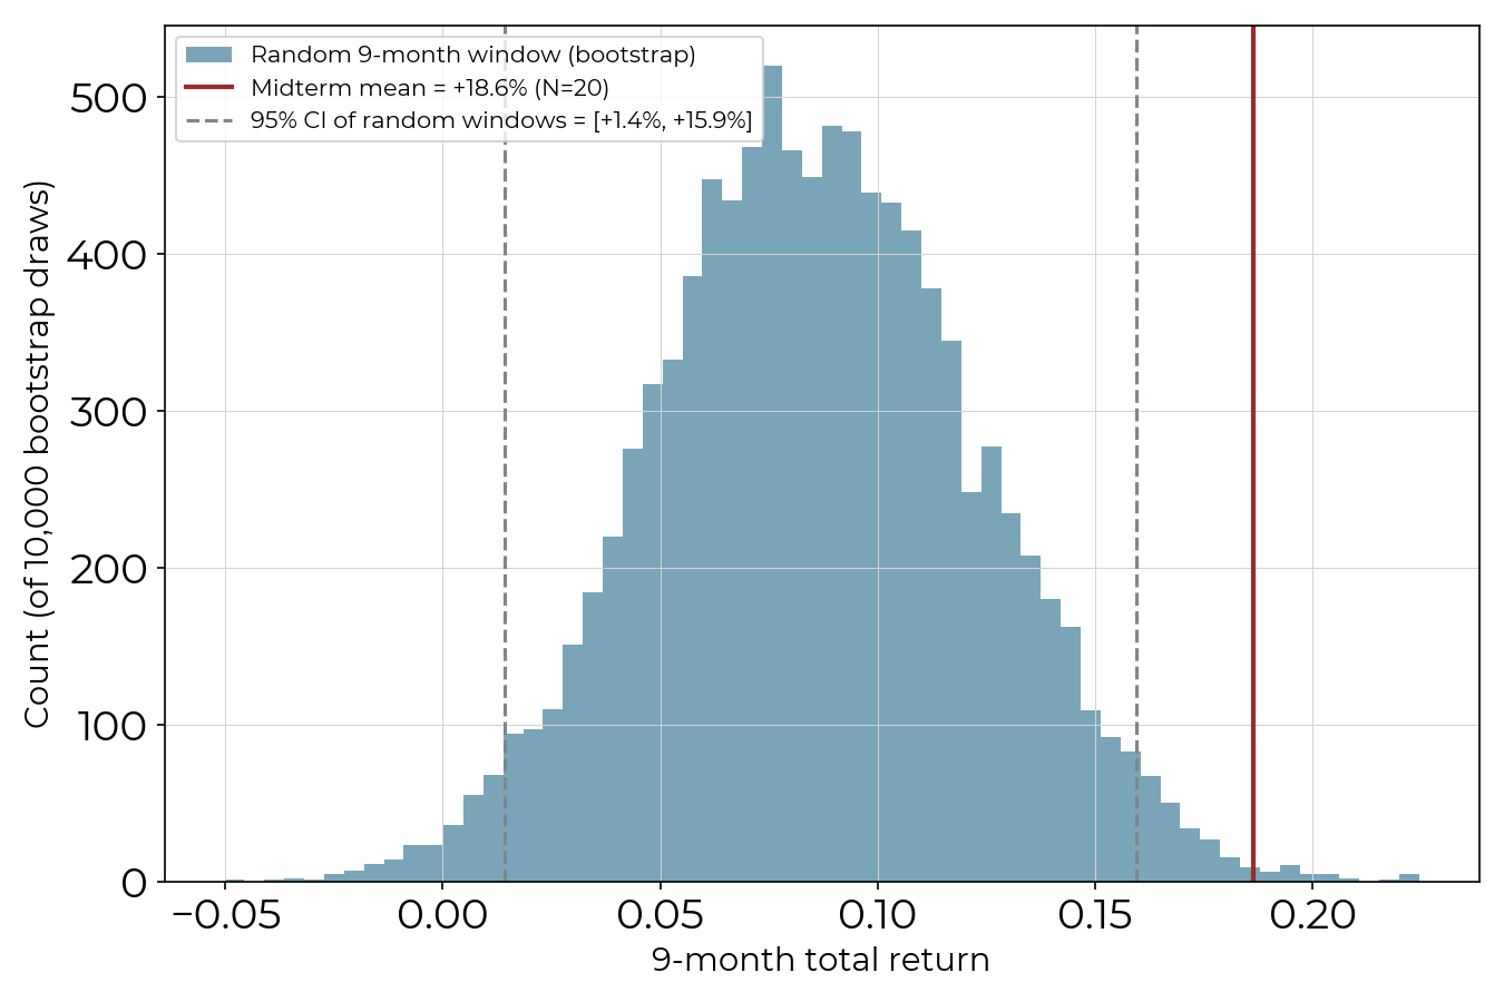
To find out whether the coin is loaded, we built 10,000 alternative histories, each stitched together from chunks of real daily returns with no reference to elections (a block bootstrap, for those keeping scores). Then we asked how often 20 random windows look as good as the 20 midterm ones.
The answer: rarely.
- Random sets of windows averaged 8.6 percent, and 95 percent of them landed between 1.4 and 15.9 percent.
- The midterm windows averaged 18.6 percent, well outside that range.
- Getting all 20 windows positive by luck happens about 0.2 percent of the time.
Observed 9-month return following each of the 20 midterm elections (1946–2022) vs. a null distribution of 10,000 randomly drawn 9-month windows from the same return series (stationary block bootstrap, mean block length 6 months, chosen to match the autocorrelation structure of monthly returns). The midterm mean sits above the 95% interval of the random-window distribution.
Source: Fama-French daily total-return data, CFM
A sceptic could still object that midterms simply tend to land at fortunate moments. Perhaps a recession was ending, or the Fed was cutting rates, or it was just the time of year: November to April has historically been a strong stretch for stocks anyway. So, we stripped those effects out. Midterm windows still showed about 15.1 percentage points of extra return since the mid-1950s, and the figure held up when we adjusted for inflation, measured returns against cash, used medians instead of means, and corrected for the fact that we asked four questions, not one. We also wrote those four questions down before looking at any results, so the goalposts stayed put.
Within its sample, then, the pattern is real. The trouble is the stories told about it.
Washington’s missing fingerprints
If the election itself were doing the work, it should leave marks. Therefore, we looked for them.
The first usual suspect was “Markets rally on relief.” If resolving uncertainty lifts stocks, bigger surprises should bring bigger rallies. We tried three measures of surprise: seat swings, chambers changing hands, and results that defied what the president’s approval rating predicted.
None had any detectable link with later returns. Twenty elections can only reveal a strong relationship, so this is “not found” rather than “disproven”. Still, it’s not much of a start.
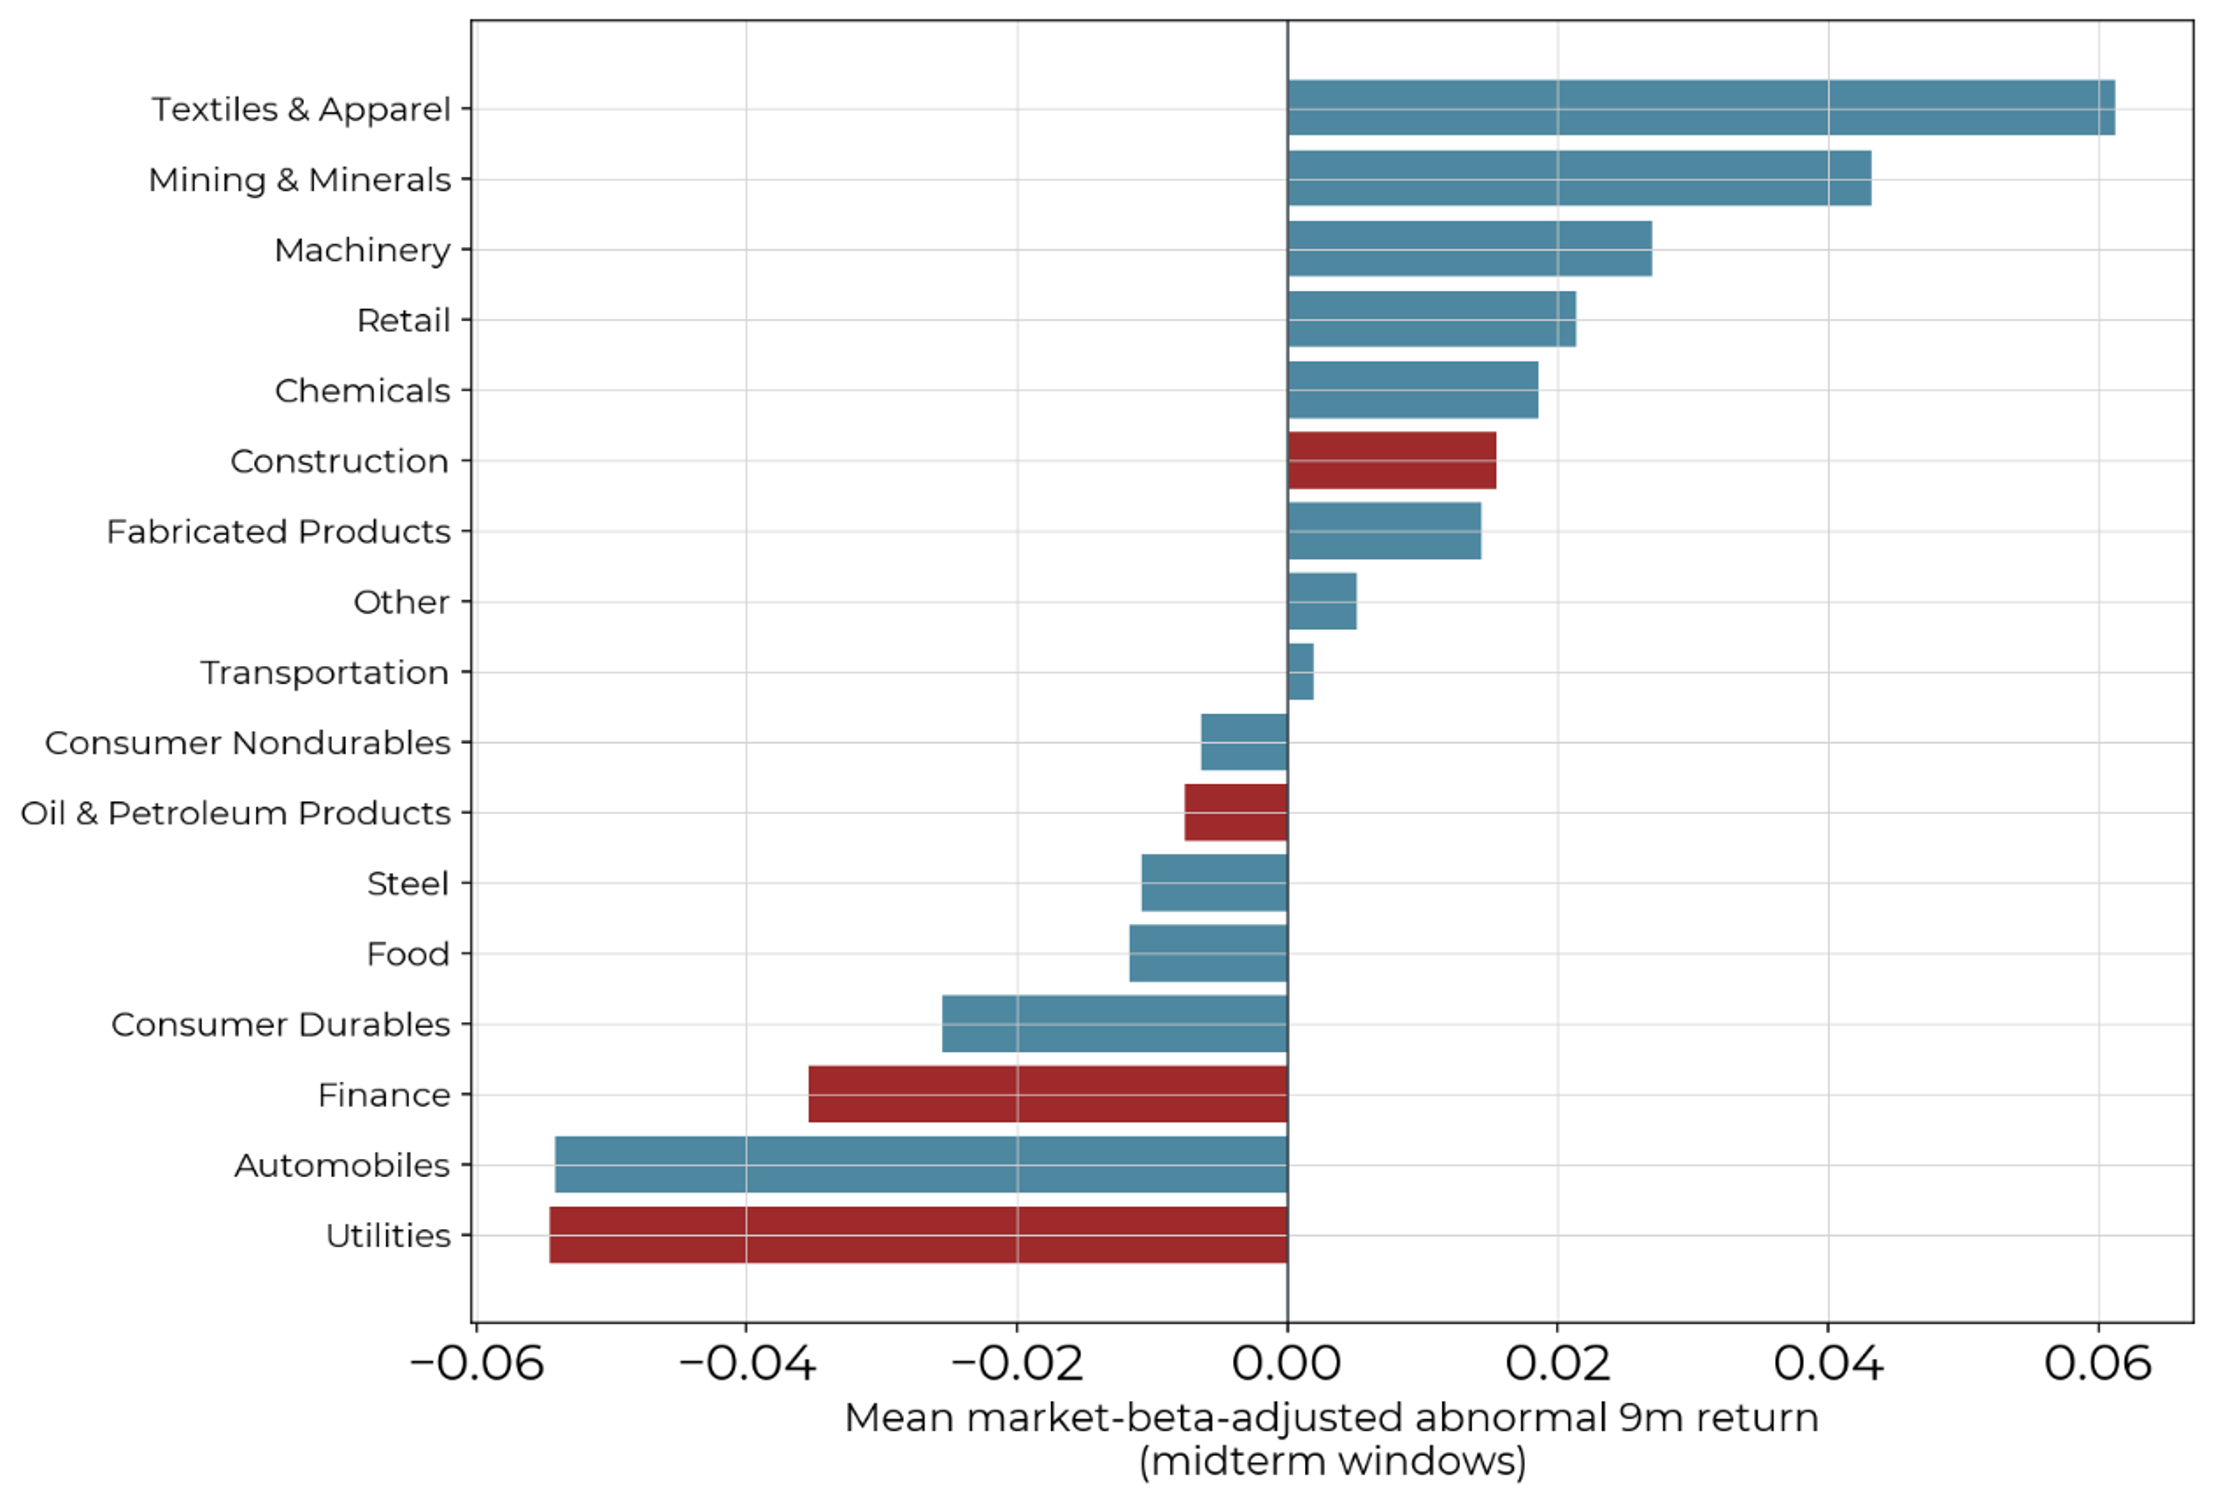
The next stop was “It’s a Washington trade.” If a change in Congress matters, it should matter most to energy, utilities, financials and construction. After adjusting for their normal sensitivity to the market, those sectors did slightly worse than everything else: −2.1 points against +0.6. The post-midterm rally is broad and boring, which is the shape of a market-wide move, not a policy bet.
Ken French 17-industry portfolios’ mean abnormal 9-month return following midterm elections, net of market beta (beta estimated on non-event months; abnormal return = realized minus beta-predicted return). Policy-sensitive sectors (oil, utilities, finance, construction) shown in red — no concentration in these sectors is evident, arguing against a sector-specific policy-repricing explanation.
Source: Ken French 17-industry portfolios and 3-factor data, CFM
The third one was “Gridlock calms markets.” This is the sophisticated version: divided
government means nothing radical passes, so volatility falls. In fact, midterms that produced a newly divided government saw slightly more volatility afterwards.
Volatility does fall after midterms in general. But markets tend to go in jittery: pre-election volatility averages 16.4 percent before midterms, against 12.6 percent before presidential elections. Jittery markets calm down on their own. Account for that, and the midterm calm shrinks by about 40 percent and becomes indistinguishable from noise.
How about “Midterms are special.” ? If voting itself lifts stocks, presidential elections should do it too. They don’t: their nine-month windows show roughly nothing (+0.4 points). The gap with midterms is about 12 points, and it isn’t borderline. It comfortably survives the correction for testing four things at once (p=0.0006, or 0.0018 once corrected).
That sounds like a point for the midterm camp, but it is what a calendar effect would produce anyway. The two elections sit at very different points in the presidential term: in the postwar data a presidential vote opened the weak early years, while a midterm opened the historically strong stretch, as the next section shows. Over the full 150 years the gap shrinks to about 4.5 points and becomes indistinguishable from noise, though it never points the other way.
The calendar did it
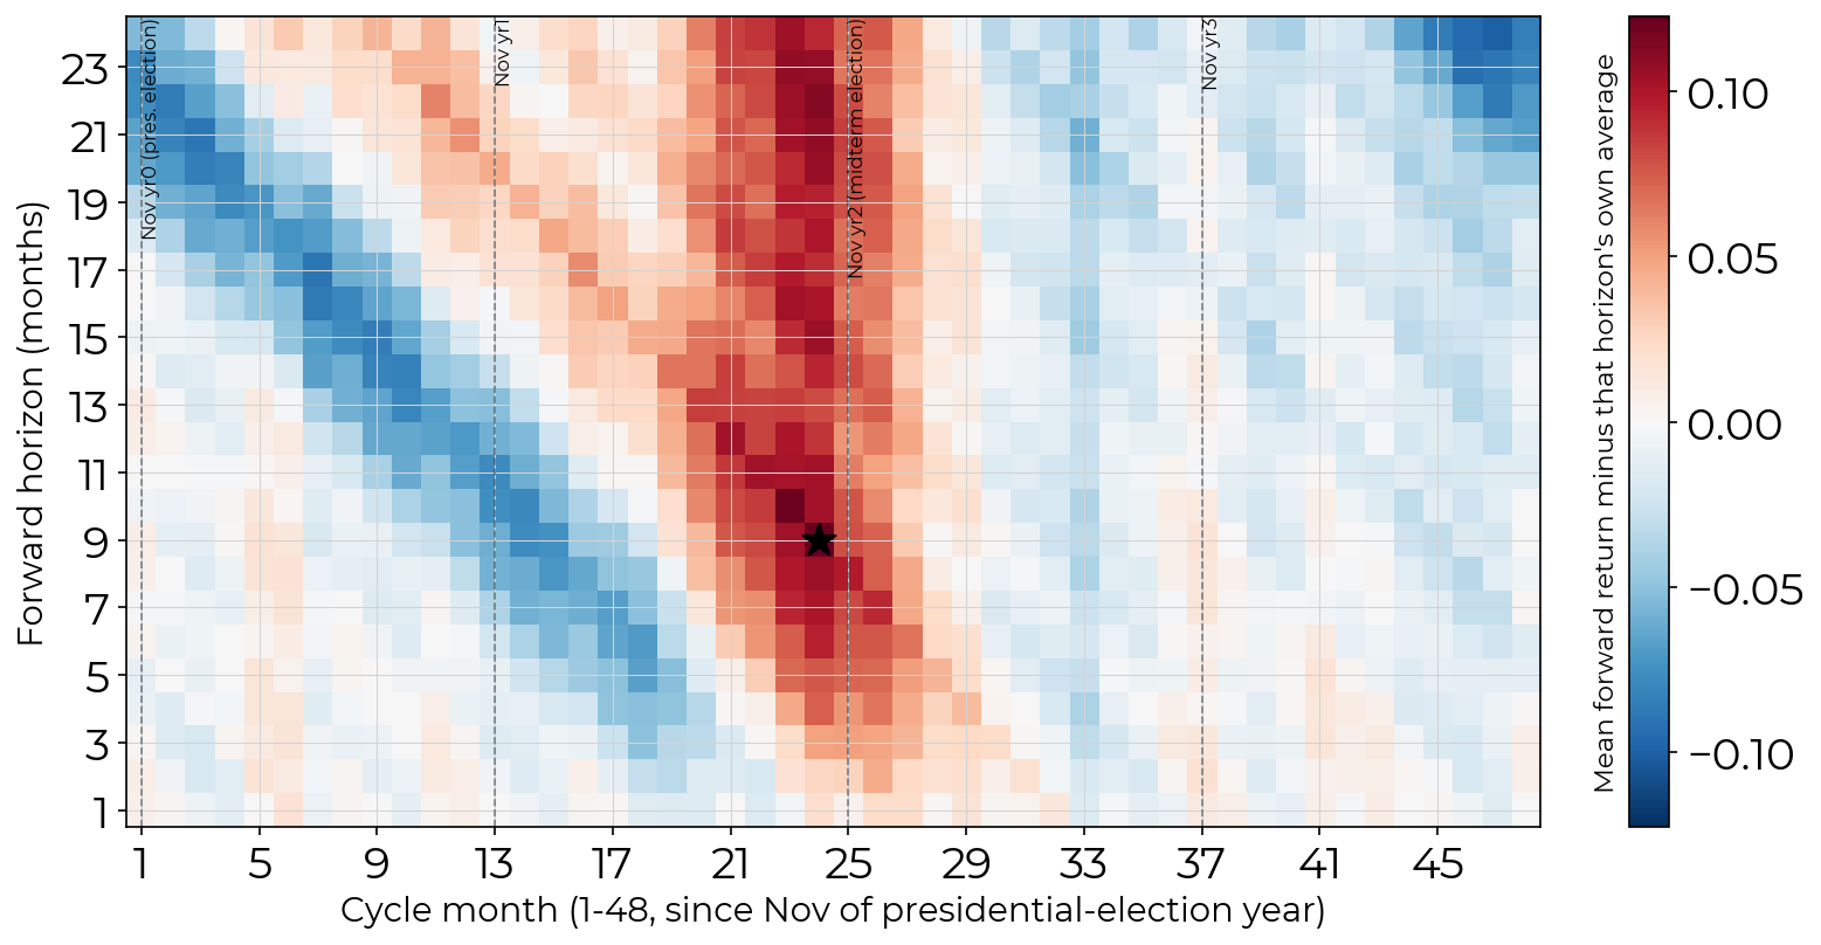
So, what does explain it? Let us take the forward return from every month of the four-year presidential term, at every holding period from one to 24 months. That gives 1,152 possible “stocks always rise after X” statistics.
Mean forward return across all 48 months of the 4-year election cycle (since November of a presidential-election year) and 24 forward horizons, with each cell demeaned by that horizon’s own average across all cycle positions — isolating the cycle-position effect from generic horizon-level drift. The star marks the midterm anchor at cycle month 24 (October of the midterm year), 9-month horizon — anchored one month before the election itself so the window doesn’t blend ~3 weeks of post-election trading into what’s meant to be a pre-election baseline, consistent with previous calculations
Source: Shiller monthly S&P composite price/earnings data, CFM
The red isn’t a dot on election day. It’s a diagonal band covering roughly late year two to year three of a presidency, and any window that spans it looks good, whenever it starts.
This is the presidential cycle, catalogued since Yale Hirsch’s Stock Trader’s Almanac1 and studied by Booth and Booth (2003)2 , among others: weak early years, a strong third. The midterm sits at its front door.
Two things from that grid matter.
Go back to the coin. One person flipping 20 heads in a row is suspicious. But hand coins to a thousand people, and someone will flip a long streak by pure luck. Pointing at that person afterwards proves nothing. Market statistics work the same way: there are 1,152 ways to slice the four-year presidential term into “stocks rise after X,” and someone looking back at history can try them all and keep whichever looks best.
So, we tested what a search that wide would turn up by luck alone. We generated thousands of fake market histories with no election pattern at all and, in each one, picked out the best-looking of the 1,152 windows. The window this article uses throughout — nine months from October of the midterm year — turns out to be the single best-looking window on the entire grid. Measured against the luck-alone benchmark, it still clears the bar, just barely: an unrestricted search would beat it by chance only about 4 percent of the time (p=0.04).
That’s weak evidence, not a knockout, and there’s a catch. Running the same search on other assets produce winners too: Month18 of the term over nine months for Treasuries, month 42 over two years for commodities, month 38 over 14 months for the dollar. Nobody talks about a pre-election commodity boom or a late-term dollar rally, because nobody had a reason to look.
The S&P 500’s best window happens to start near an election, which comes with a story already attached. Picking the start date and the horizon after looking at the data, then naming the result after whatever happened nearby, is overfitting by definition.
Whatever its origin, it behaved like a calendar effect. The extra return built up over the first six to nine months and then heldsteady: about 10 points at nine months, and still 9.8 points at 18 months. Stocks didn’t rise and then fall back. They stepped up as the market entered the historically strong part of the presidential term, and stayed at the higher level.
What actually drives the step up? A share price can rise for two reasons: the company earns more, or investors become willing to pay more for each dollar it earns. The first is growth. The second is optimism, or what analysts call a re-rating.
After midterms, prices rose about 12 points3 more than usual. Roughly 3 of those points came from faster earnings growth and roughly 9 from investors paying more for the same earnings. Thus, it leans towards optimism. But with only 20 elections, each piece swings around so much that we can’t be confident either one is really above zero on its own. The total is clearly unusual. How it splits is a guess, with error bars you could park a truck in.
The 150-year asterisk
Here’s the part the commentary leaves out. US stock data doesn’t start in 1946. Ken French’s daily returns reach back to 1926, and Robert Shiller’s monthly series to 1871.
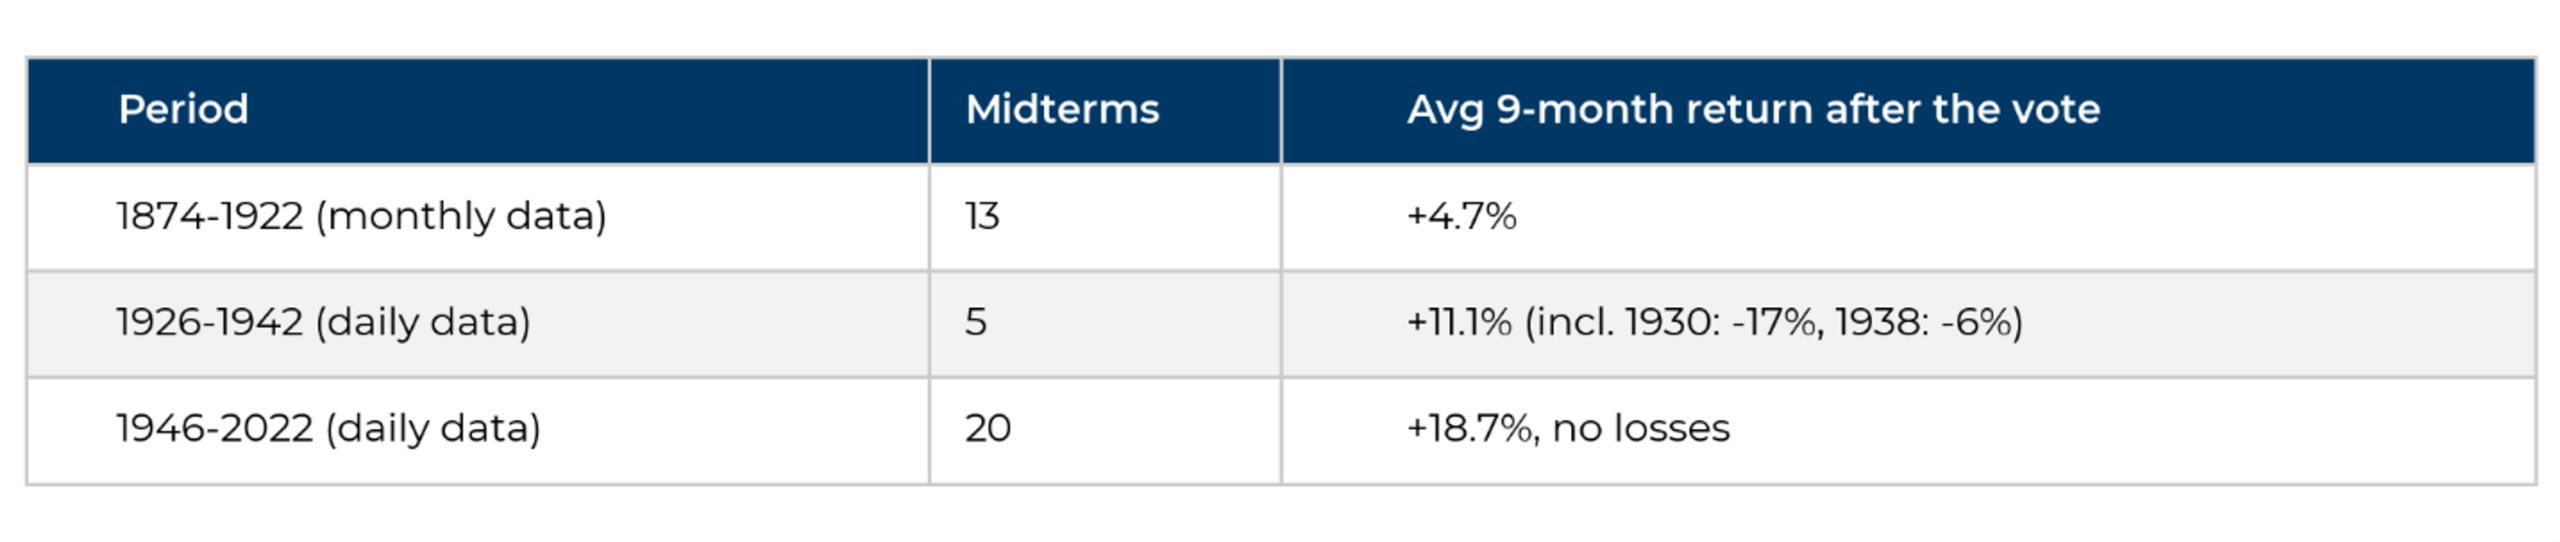
Average 9-month return following each midterm election by era and underlying data source: Shiller monthly only (1874–1922), Fama-French daily (1926–1942, including two down years), Fama-French daily (1946–2022, no losses). The “never lower” pattern is a feature of the modern era, not a 150-year constant.
Source: Shiller monthly data (1874–1922) and Fama-French daily data (1926–2022), CFM
Before 1926, post-midterm returns were unremarkable for their era. The 1930s produced two losses, so start the clock in 1926 and “never lower” becomes 23 out of 25. Measured the same way in both periods, postwar midterms beat their predecessors by about 15 points (p=0.001). The cruder pre-1926 data accounts for only a sliver of that gap.
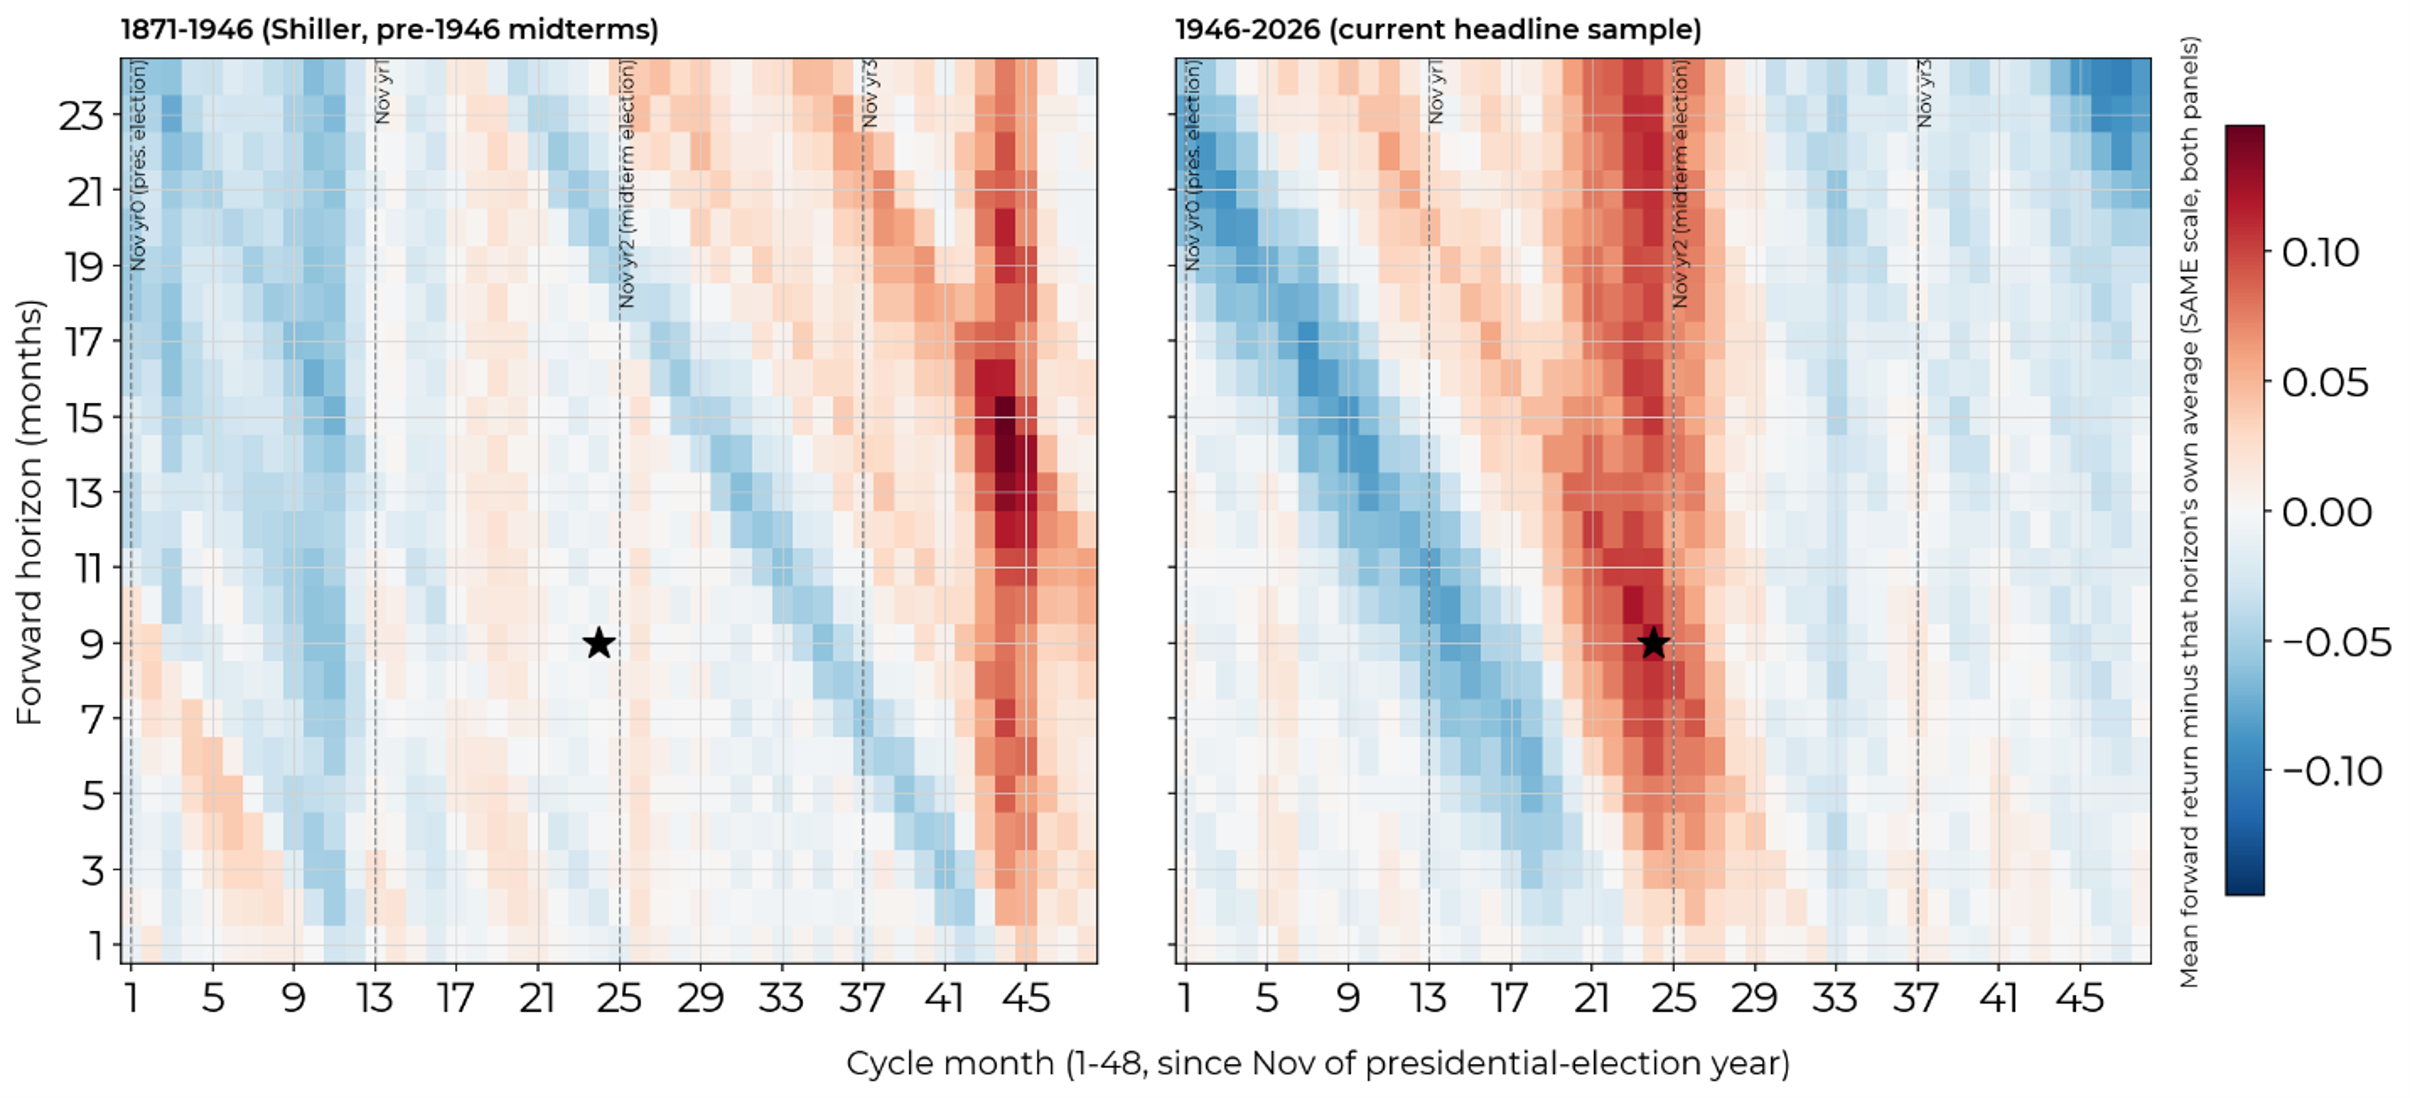
Same demeaned cycle grid as Chart 3, computed on the 1871–1946 sample (left) and the 1946–2026 sample (right), plotted on one shared color scale so equal shading means equal magnitude. The two eras’ grids are effectively uncorrelated with no post midterm rally before 1946.
Source: Shiller monthly S&P composite price/earnings data, CFM
Then comes the bit that should worry the sceptics as much as the believers. When we rerun the full 1,152-window search over 150 years, the band is still visible, but roughly half as intense. The strongest cell anywhere on the grid is no longer distinguishable from chance: p=0.52, against 0.04 for the postwar data alone. The presidential cycle, the standard rebuttal to the midterm myth, turns out to be a postwar pattern too.
Why might the postwar era differ? Plausible candidates include:
- presidents with the fiscal tools, and the incentive, to simulate the economy before re-election
- a modern Federal Reserve
- a different kind of business cycle
These are hypotheses, not findings. Cynical reading is also available: eighty years is long enough for a coincidence to pick up a name.
So, never lower?
The streak is real, and unusual for the postwar era even after the obvious controls. No election story holds up: not relief, not sectors, not gridlock. It looks like a calendar effect, with election day as a convenient bookmark. Over 150 years, even the calendar effect fades, but did not flip in the periods we examined . “Never lower” is an accurate statement about the past that could sound like a statement about the future. Whether it holds again is uncertain.
We wrote the next test down before the vote. The midterm is on November 3 2026, and the nine-month window closes on August 3 2027. On that date we’ll look at three numbers, whatever they will show: the total return from election day, the price return which is what the popular claim measures, and the excess over a typical nine-month window.
One result won’t settle much. A gain makes it 21-for-21; a loss makes it 20-for-21. Either way, the statistics will be back in two years.
Meanwhile, if you’ve been told this is a sure thing: it’s an 80-year regularity of uncertain cause, sitting inside a 150-year record that doesn’t share it. Which, to be fair, describes a good deal of finance.
1 The idea that stocks follow the presidential term was popularized by Yale Hirsch’s Stock Trader’s Almanac: returns are weak in the first two years of a term, including the midterm year, and strong in the two years before the next presidential election.
2 Booth and Booth (2003) found the pattern survives controls for economic conditions. Booth, J. R., & Booth, L. C. (2003). “Is presidential cycle in security returns merely a reflection of business conditions?” Review of Financial Economics, 12(2), 131–159. https://doi.org/10.1016/S1058-3300(02)00061-7
3 This measure is price return only, without dividends, and isn’t adjusted for recessions, Fed policy or the calendar. So it isn’t directly comparable with the 15.1-point figure mentioned before.
Disclaimer:
Historical data and statistical patterns described in this document are not a reliable indicator of future results.
Any statements regarding market events, future events or other similar statements constitute only subjective views, are based upon expectations or beliefs, involve inherent risks and uncertainties and should therefore not be relied on. Future evidence and actual results could differ materially from those set forth, contemplated by or underlying these statements. In light of these risks and uncertainties, there can be no assurance that these statements are or will prove to be accurate or complete in any way. All opinions and estimates included in this document constitute judgments of CFM as at the date of this document and are subject to change without notice. CFM accepts no liability for any inaccurate, incomplete or omitted information of any kind or any losses caused by using this information. CFM does not give any representation or warranty as to the reliability or accuracy of the information contained in this document. The information provided in this document is general information only and does not constitute investment research or investment or other advice. The content of this document does not constitute an offer or solicitation to subscribe for any security or interest.