For the better part of two decades, the active management industry delivered on its promise. Hedge funds generated genuine alpha. Long-only managers routinely outperformed their benchmarks. Allocators could justify the fees because, in aggregate, the numbers worked. Then, somewhere around 2012, the music stopped.
The cumulative evidence from thousands of funds, spanning both long-only and long/short strategies, points to the same uncomfortable conclusion: active equity returns have not just declined. They first flatlined and have since effectively disappeared.
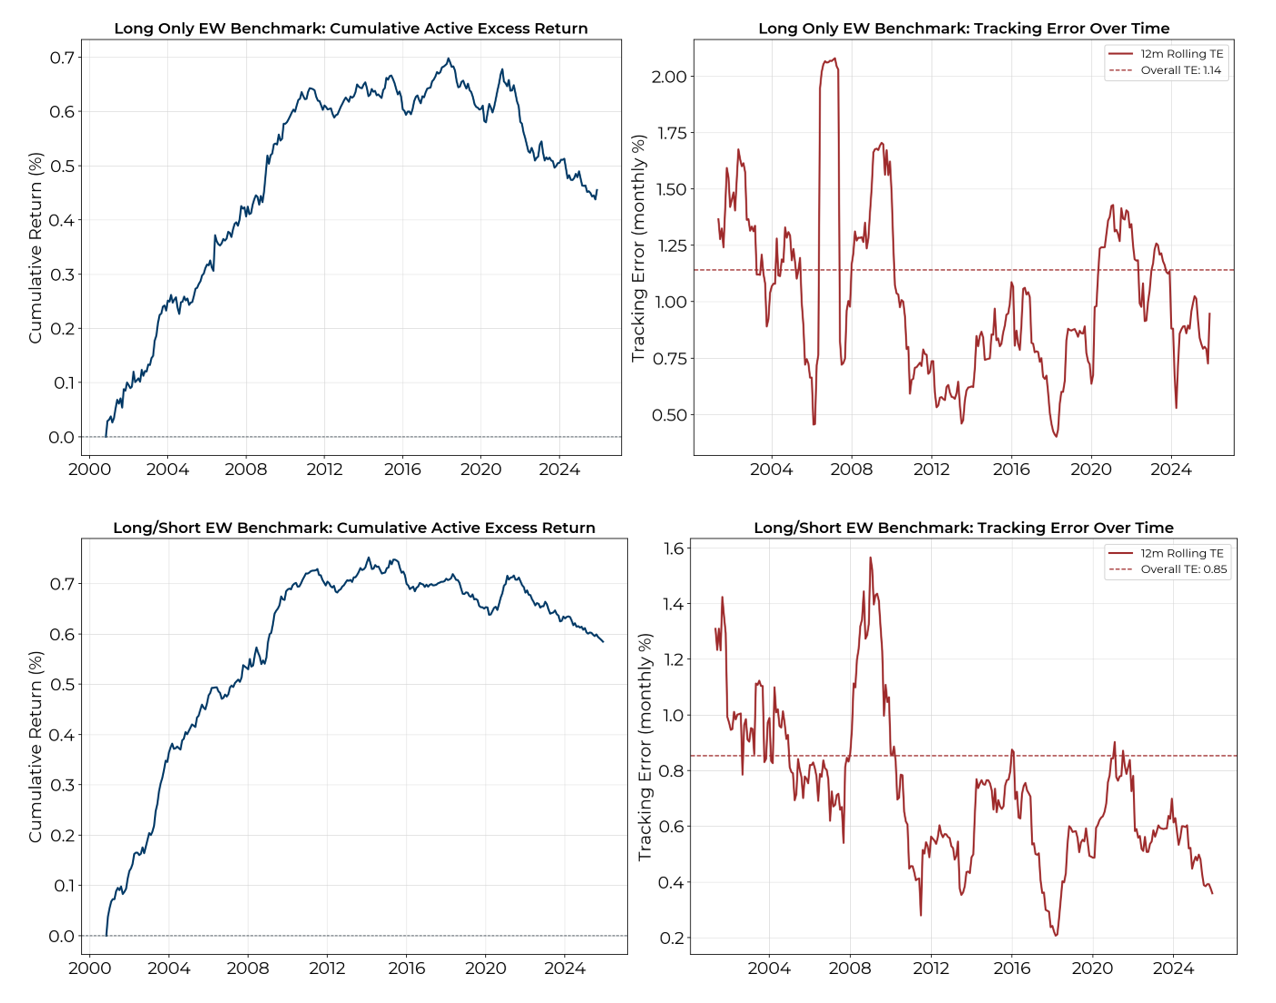
To see this clearly, one needs to move beyond the marketing materials of individual managers and look at the industry as a whole. We constructed equal-weighted benchmark indices from the Preqin database, aggregating the monthly returns of every US-focused equity fund with a sufficiently long track record. One benchmark covers long-only strategies, the other equity long/short. For each, we computed the active excess return—the component of performance that remains after subtracting both the risk-free rate and the fund’s rolling-beta-adjusted market exposure—and tracked it over time.
The pattern is broadly similar across both strategy types, though the details differ. Through the 2000s and into the mid-2010s, cumulative active returns climbed steadily. The industry, in aggregate, was adding value. For long-only funds, the cumulative active return peaked around the mid 2010s near 0.70% and has since given back roughly a third of those gains. For long/short funds, the peak came slightly earlier, around 2012-2014, with a more gradual erosion since. In both cases, what was once a clear upward trend has become a downward one.
The tracking error picture is also revealing, though in different ways. Long-only tracking error has been volatile but without a clear trend. Long/short tracking error, by contrast, has declined persistently, falling from above 1% in the early 2000s to roughly 0.4% today. These funds are taking progressively less active risk, and what risk they do take is generating less return.
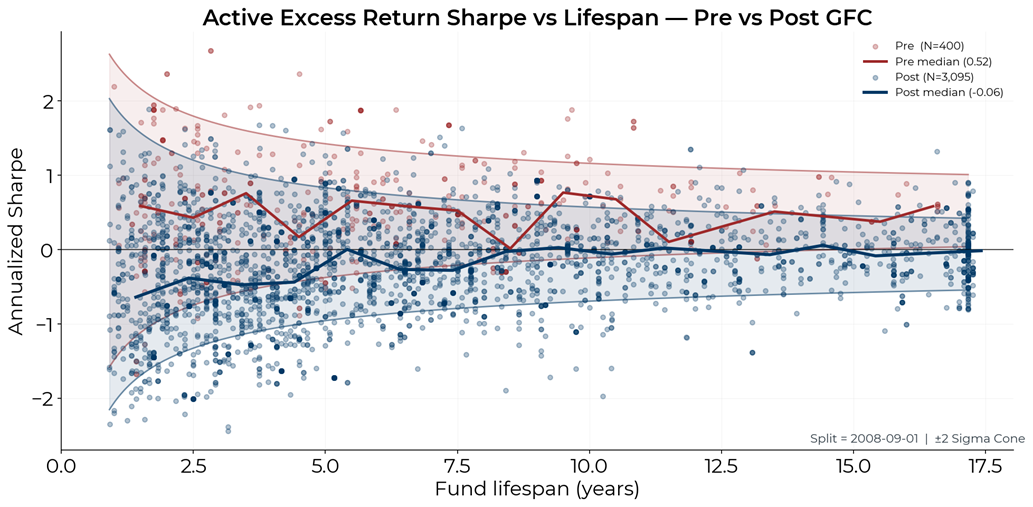
This is not simply a story about a bad decade for stock pickers. The data suggests something more structural. To quantify this, we computed the annualized Sharpe ratio of each fund’s active excess return over its lifetime and plotted it against the fund’s lifespan. We then split the sample in September 2008, the onset of the Global Financial Crisis, which serves as a natural watershed between the industry’s two eras.
The contrast between the two eras is difficult to dismiss as noise. Funds that operated primarily before the crisis delivered a median Sharpe ratio on their active returns of 0.52, a respectable figure by any standard, particularly after stripping out market exposure. The post-crisis cohort, nearly eight times larger and therefore estimated with considerably greater precision, delivered a median of negative 0.06. Lo’s (2002) standard errors for Sharpe ratio estimators confirm that the difference between the two cohorts is not a small-sample artifact1. With over 3,000 funds in the post-crisis sample, the confidence bands leave little room for charitable interpretation.
Even the most celebrated active investor of the modern era has not been immune. Berkshire Hathaway’s Class A shares delivered a residual Sharpe ratio of 0.48 before the crisis. Since 2009, that figure has fallen to 0.06, statistically indistinguishable from zero.
Two reinforcing forces explain the change. The first is that the benchmark itself has been historically exceptional. The S&P 500’s annualized excess return since 1870 is approximately 5.8%, with a full-period Sharpe ratio of around 0.35. Over the past fifteen years, rolling ten-year Sharpe ratios have frequently exceeded 0.8, placing this period among the strongest in over a century of data. Beating a market delivering historically unusual returns is, by definition, unusually difficult..
The second force is the enormous acceleration of passive flows after 2008: trillions moved from active mutual funds into index vehicles. As the passive share of equity markets grew, the pool of less-informed capital that active managers had historically profited from shrank. The aggregate tracking error decline visible in Figure 1 is consistent with this: funds are converging towards similar portfolios, which in turn converge towards the benchmark.
The consequences of this shift are visible in the most basic metric an allocator can compute: how many of my managers are actually making money relative to the market?
Before 2008, the majority of active funds were beating the market over any given trailing year. The fraction regularly exceeded 60% and sometimes approached 80%. Since the crisis, the picture has inverted. The share of funds with positive trailing twelve-month active returns now frequently dips below 40%, and in the worst stretches falls to 20-30%. For long periods, a coin flip would have been a better guide to manager selection than any due diligence process.
None of this is an argument that active management is dead, or that alpha has ceased to exist in any form. There remain managers who deliver persistent, statistically significant excess returns. But the aggregate data makes clear that these managers are the exception, not the norm, and that the post-crisis environment has been structurally hostile to active equity strategies in a way that the earlier era was not. The industry’s golden age now lies more than a decade in the past. What has replaced it is an era in which the principal challenge for most active managers is not generating alpha but justifying fees in its absence.
1 A. Lo, “The Statistics of Sharpe Ratios,” Financial Analysts Journal, 58(4), 2002. Lo shows that Sharpe ratio estimates carry standard errors on the order of √((1 + SR²/2) / T), meaning that short track records can produce wildly misleading estimates of risk-adjusted skill.
DISCLAIMER
Any description or information involving modes, investment processes or allocations is provided for illustrative purposes only and does not constitute investment advice nor an offer or solicitation to subscribe for any security or interest. Any statements regarding correlations or modes or other similar behaviors constitute only subjective views, are based upon reasonable expectations or beliefs, and should not be relied on. All statements herein are subject to change due to a variety of factors including fluctuating market conditions and involve inherent risks and uncertainties both generic and specific, many of which cannot be predicted or quantified and are beyond cfm’s control. Future evidence and actual results or performance could differ materially from the information set forth in, contemplated by or underlying the statements herein. CFM accepts no liability for any inaccurate, incomplete or omitted information of any kind or any losses caused by using this information. CFM does not give any representation or warranty as to the reliability or accuracy of the information contained in this document.