This article was first published by Pensions & Investments on 12th October 2026: Link here
A Systematic View of How Liquidity Shapes Markets
Alternative market products have attracted large inflows over the past few years, fueled by the perception of outsized returns in less efficient markets. A steady flow of these products has emerged from the biggest commodity trading advisor (CTA) players employing a trend following approach to instruments that are far less liquid than traditional futures markets, such as the E-mini S&P 500, 10-year Treasury and crude oil futures. Performance in active programs trading these less liquid alternative markets can be generated by fund flows, according to Capital Fund Management (CFM), a Paris-based quantitative manager specializing in multi-strategy, multi-asset programs.
The implications of illiquidity go beyond simply trying to transact in assets that aren’t publicly traded. “Illiquidity raises transaction costs, which cuts into performance,” said Philip Seager, Head of Portfolio Strategy at CFM. “Illiquid asset pricing is often driven by the direction of fund flows, as strong inflows can drive prices higher and the opposite is true for outflows.”
Understanding price impact
“The impact of trading illiquid assets is dependent on liquidity, meaning that the less liquid the market is, the more trading can push prices. We have traded in many financial markets for decades, so we can measure this effect. More liquid markets are less costly because there is less price impact,” Seager said.
As a global systematic manager, CFM aims to scale up its strategies because its institutional clients are looking to allocate in size, he noted. But allocating to less liquid markets becomes more difficult with scale, resulting in progressively smaller allocations to alternative markets relative to the size of the overall portfolio that includes the more traditional liquid markets. At some point, they’re not worth adding because their contribution to gains and risk is too slight to matter.
“That’s what happens with illiquid alternative markets,” Seager said. “If you’re accounting for costs properly in an optimization scheme, then you end up not allocating to them. It tends to be the case that once we’ve optimized for the size that we want in the market, we haven’t allocated anything to the alternative markets. That’s the reality for us, no matter what type of strategy it is.”
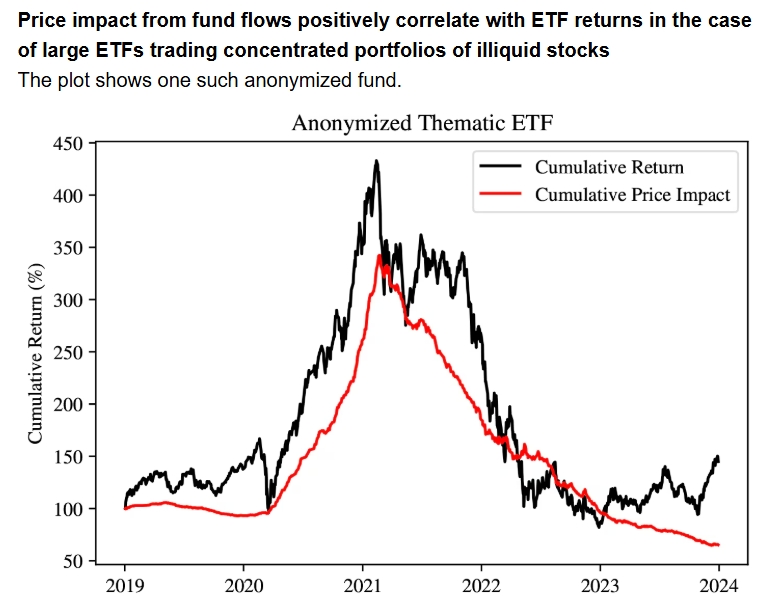
Source: Philippe van der Beck, Jean-Philippe Bouchaud and Dario Villamaina, “Ponzi Funds,” Papers 2405.12768, arXiv.org., May 22, 2024.
Flows can influence returns
As with transaction costs, fund flows can directly affect the performance of illiquid assets. CFM began thinking about this a few years ago in the context of alternative market funds managed by trend following CTAs.
Since getting the relevant alternative market CTA data to support its hypothesis proved impossible, the firm turned to exchange traded funds as a surrogate for alternative market CTAs. It looked at large ETFs with concentrated positioning in small-cap stocks and found plenty of data to analyze. The result was “Ponzi Funds,” a 2024 paper co-authored by Jean-Philippe Bouchaud, CFM’s chairman and chief scientist.
Seager noted that the reference to “Ponzi” is not an accusation of fraud. The funds were Ponzi in spirit, in the sense that a Ponzi scheme is supported by fund flows: It needs inflows from later investors to pay off earlier investors. The demise of such a scheme comes when the flow stops.
The paper modeled the profitability of a set of very large ETFs trading concentrated portfolios of small cap, illiquid names, against the price impact coming from trades generated by changes in the net asset value of the ETFs. CFM has written extensively on the subject of modeling price impact arising from trades, and it used similar work to compare price returns arising from ETF flows — impact was positive in the case of inflows and negative for outflows — versus the actual returns of the funds.
As the chart shows, the paper found a strong link between the ETF’s cumulative price impact and its return for one such example ETF: they were correlated by more than 40%. During the period covered, the ETF’s positions were 20 times larger than the daily dollar volume in its underlying stocks. This implied that whenever the ETF received a 1% inflow on a certain day and proportionately rescaled its positions, it bought 20% of the underlying stocks’ daily volume. Because the portfolio was heavily concentrated in these individual securities and it received over 200% inflows, its own price impact drove a large share of its return.
As Seager pointed out, “If you do this same exercise when the underlying names are very liquid as, for example, in the SPDR ETF, SPDR’s flows alone explain less of the performance of the S&P 500 because the underlying stocks are so liquid in comparison to the size of SPDR.” He added, “There are many other factors affecting the S&P 500’s stocks that are completely unrelated to the flows of ETFs.”
Applying this same logic to alternative market CTAs can potentially explain their outperformance in the distant past on the back of initial good performance attracting inflows. “Over the past couple of years, alternative market CTAs have underperformed their traditional counterparts. Our belief is the flow has reversed, weighing heavily on performance, and firms now trade too much in markets that do not have the liquidity to support it,” Seager said.
Diversification and alpha
The arguments to support trend following programs trading alternative markets is firstly, that they are able to diversify beyond more traditional markets, and secondly, that these less traded markets are less efficient, offering more opportunities for alpha. However, the period around March 2023 was particularly difficult for traditional and alternative markets alike. To understand what happened in this period, one must see it in the context of 2022, a time when U.S. interest rates rose from close to zero to over 4%, as inflation surged following COVID and the start of war in Ukraine, he noted.
When 2023 began, CTAs — which are synonymous with trend-following — were short bond futures. Most managers were caught flat footed in March that year when Silicon Valley Bank collapsed due to mismanaged interest-rate exposure. Bonds rallied sharply as investors felt that the Federal Reserve would have to change course.
In Seager’s view, this big reversal in sentiment was a short-term phenomenon. Nonetheless, “it was a very bloody affair for CTAs which had an aggregate loss, one of their worst periods in terms of performance,” he said. “Alternative market CTAs blew up just like traditional market CTAs did. The argument that you get extra diversification by trading in these so-called alternative markets just didn’t work.”
Seager pointed out that a trend following approach applied to alternative markets and compared to the same number of traditional markets revealed no evidence of a lack of efficiency in the alternative markets. “Accounting and correcting for correlations between instruments, which exist as much among alternative markets as in the case of traditional markets, reveals levels of risk-adjusted returns that are perfectly consistent between the portfolios of alternative and traditional markets.”
Shifting investor needs
Institutional appetite for illiquid assets is in a state of flux these days. Some institutions are increasing exposure to private markets, while many with substantial allocations face liquidity pressures. They’re rethinking both the size of their commitments and how to restructure their portfolios in today’s more convergent market environment between public and private assets.
CFM is receiving increased attention from institutional allocators in search of solutions. “There is strong interest in our products and we are enjoying a successful year in terms of raising money,” Seager said. “Since performance is what investors are really after, we are seeing demand because we seek to offer absolute returns along with genuine diversification, meaning uncorrelated returns. Our efforts to do so, aided by avoiding exposure to illiquid assets, helps to differentiate us from other managers.”
Disclaimer
Any description or information involving modes, investment purposes or allocations is provided for illustrative purposes only and does not constitute investment advice nor an offer or solicitation to subscribe for any security or interest. Any statements regarding correlations or modes or other similar behaviors constitute only subjective views, are based upon reasonable expectations or beliefs, and should not be relied on. All statements herein are subject to change due to a variety of factors including fluctuating market conditions and involve inherent risks and uncertainties both generic and specific, many of which cannot be predicted or quantified and are beyond CFM’s control. Future evidence and actual results or performance could differ materially from the information set forth in, contemplated by or underlying the statements herein. CFM accepts no liability for any inaccurate, incomplete or omitted information of any kind or any losses caused by using this information. CFM does not give any representation or warranty as to the reliability or accuracy of the information contained in this document.