Groundhog Day
Summary
In the movie Groundhog Day, the main character relives the same day over and over. In markets, the pattern rhymes: a shock to the US exceptionalism thesis, a selloff in US assets, an external catalyst that triggers both the shock and the reversal, and a temporary reassertion of the status quo. We’ve now seen this cycle play out twice in under a year on tariffs, and a conflict in the Middle East is providing cover for a third. Although binary geopolitical events are notoriously difficult to predict, if the world is able to reopen the Strait of Hormuz, we expect investors to continue selling US assets at the margin.
In April 2025, the President called into question the exceptionalism of the United States by levying aggressive tariffs against trading partners. The market reaction was a broad selloff in US assets—bonds and equities—alongside a weakening dollar. The reaction was short-lived. The President walked back the timing and severity of the tariffs, a hallmark of his negotiating style.
In early January 2026, the President suggested that Greenland is a strategically important asset to the United States, both for critical minerals and national security. He floated the possibility of using force to acquire it and threatened to increase tariffs on uncooperative countries, including some that had, in principle, reached a trade deal with the United States. This was followed by the President and his inner circle visiting Davos, where meetings with several European leaders proved contentious. The market reacted similarly to April’s Liberation Day, again selling US assets—bonds, equities, and the dollar—and the narrative shifted once again to whether US exceptionalism was at risk.
Then the Middle East escalated. In late February, the United States and Israel launched a joint military operation against Iran. The Strait of Hormuz is now effectively blocked, disrupting roughly 20% of global oil supply and sending energy and chemical prices sharply higher. The United States, as a net energy producer, is relatively insulated. Europe and Asia are not. The disruption has hit energy-importing economies, driving underperformance in equities, bonds, and currencies across these regions and partially reversing the rotation out of US assets.
The blockage of the Strait of Hormuz is untenable for the global economy. Too many countries—importers and exporters alike—depend on that chokepoint for a prolonged closure to persist. A diplomatic or military solution will be required to restore energy flows, because the alternative is a global recession that no major economy wants. Once resolved, the structural forces driving capital out of the United States—stretched valuations, concentration risk, policy unpredictability, and a weakening dollar—reassert themselves. The Groundhog Day cycle breaks.
Below, we examine the holdings and flows of US-domiciled investors abroad and foreign-domiciled investors into the United States to explore whether US exceptionalism is at risk in the longer term.
Who Owns America
The Treasury requires both US-domiciled and foreign investors to report holdings and flows. The resulting dataset—known as TIC (Treasury International Capital)—has known measurement issues, the most significant involving the Cayman Islands. Research by the Federal Reserve1 has shown that hedge fund holdings of Treasuries are substantially understated because positions held through prime brokers and lending arrangements known as repo chains are attributed to the brokers and dealers rather than the funds themselves. Properly accounted for, the Fed estimates that hedge funds—most domiciled in the Cayman Islands—are likely the single largest holders of US Treasuries, driven in large part by the basis trade, a leveraged strategy that exploits small price differences between Treasury bonds and Treasury futures. This matters for interpreting both the holdings and flow data that follow.
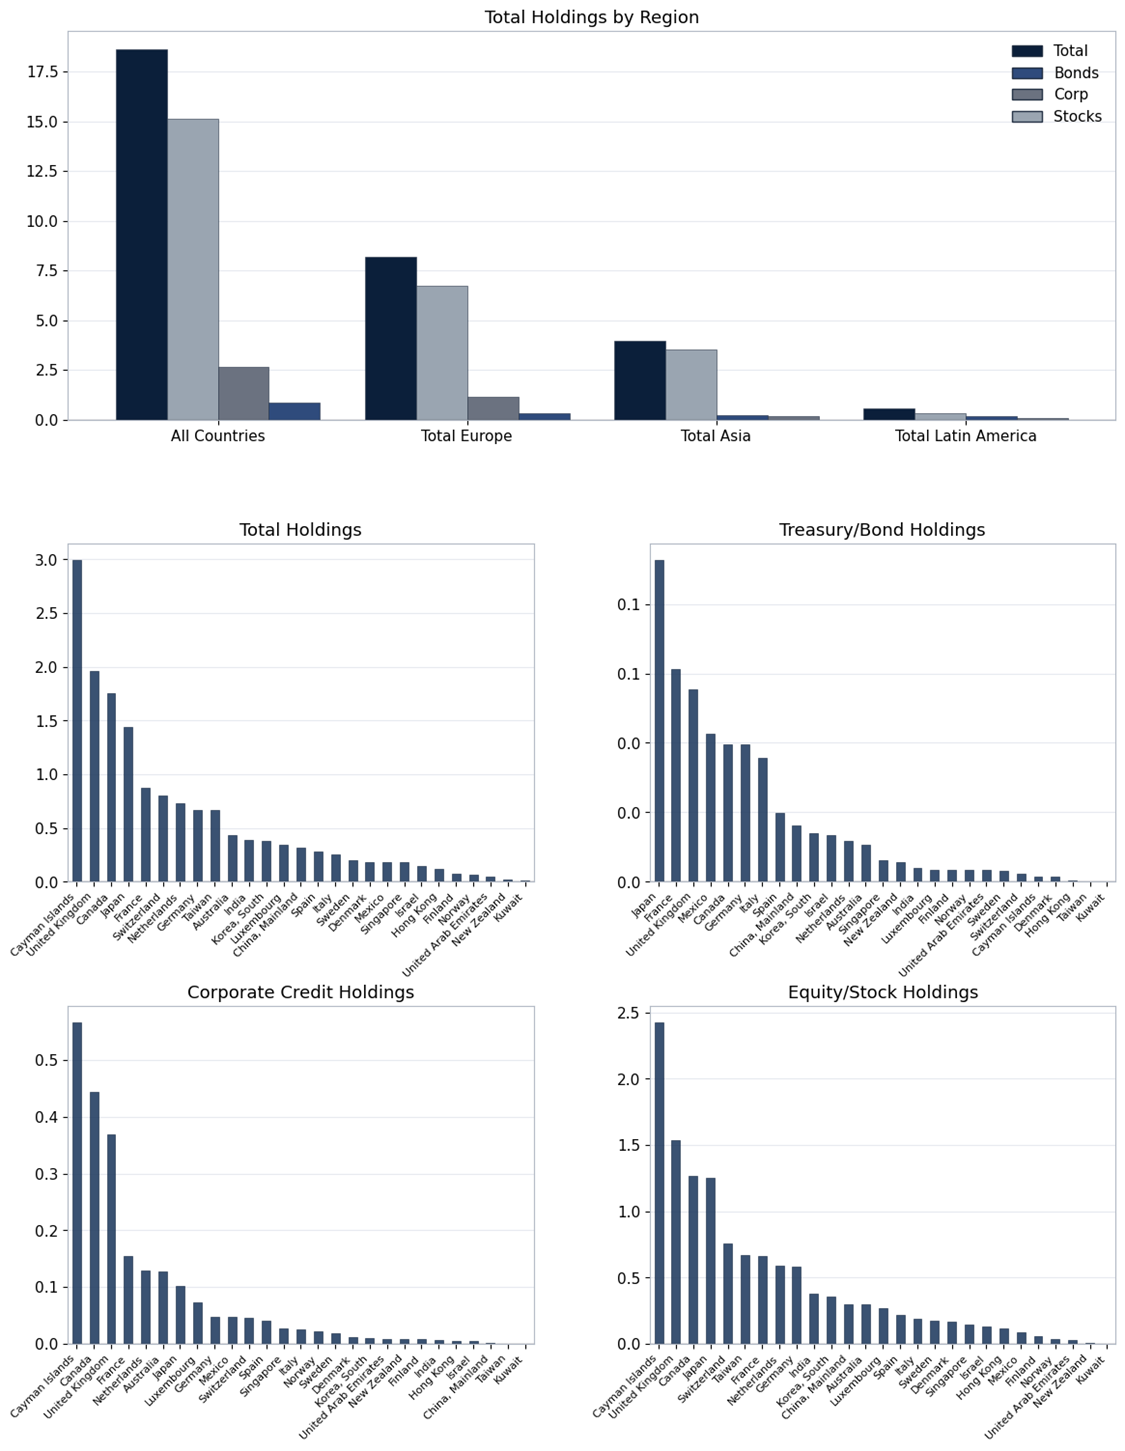
Figure 1 shows foreign holdings of US assets in aggregate, by region, and for select countries as of December 2025. In aggregate, foreigners own $36 trillion in US assets: Treasuries account for $7.8 trillion, agencies—government-backed mortgage bonds—$1.4 trillion, corporate bonds $5 trillion, and equities $22 trillion.
Europe holds $17 trillion in US assets. Asia holds $10 trillion. We also show a selected basket of countries spanning smaller, open economies with well-developed pension schemes—Australia, Canada, and the United Kingdom; countries with large trade surpluses that recycle accumulated savings into US assets—the Middle East and China; as well as countries with favorable tax and regulatory environments that attract savings pools and hedge funds—the Cayman Islands, Luxembourg, Switzerland, and Singapore.
Japan is the largest reported holder of Treasuries at $1.1 trillion, a legacy of running large trade surpluses in prior decades. The United Kingdom, China, and France are also large holders. China has been reducing its Treasury holdings as the composition of its trade surplus has shifted from the United States to Europe and Asia on account of tariffs. There are geopolitical reasons as well: the Biden administration’s decision to sanction Russia and freeze dollar assets held in the US financial system has led some at-risk countries to shift reserves, including by increasing purchases of gold. China is also moving holdings to jurisdictions with favorable disclosure requirements, including Luxembourg. As a result, the magnitude of China’s Treasury reduction is likely overstated. But the direction is not in question. China is diversifying away from US assets, and the weaponization of the dollar-based financial system has given other countries reason to do the same, even if slowly.
In US corporate credit, Europe collectively holds $3 trillion. Insurance companies and pensions dominate these flows, constructing portfolios against liabilities where credit— both public and private—offers a pick-up above government bonds with the potential for attractive total returns. The United Kingdom, Japan, and Canada collectively hold $1.1 trillion in US corporate credit. Hedge funds, domiciled in the Cayman Islands, hold $530 billion more. Beyond public markets, foreign pensions and insurers are making large allocations to US private credit, direct lending, and infrastructure—flows that do not appear in TIC data but represent another layer of foreign capital in US markets.
Collectively, foreigners hold $22 trillion in US equities. The attractiveness of the United States for equity investment is unparalleled—it offers the deepest, most liquid markets in the world, a favorable regulatory environment, and is home to many of the world’s most profitable companies, which have delivered significant long-term outperformance versus other markets. Many investors have a fiduciary duty to their stakeholders and will invest in assets that offer the best risk-adjusted returns; the United States is an important part of many such portfolios. The question is whether a $22 trillion position built over decades of outperformance has become a crowded trade, and what happens at the margin when the assumptions underpinning it—dollar strength, valuation expansion, policy stability—begin to shift.
At the country level, the Cayman Islands—again reflecting hedge fund domicile, not domestic savings—is the largest holder of US equities at $2.37 trillion. Canada, with a small open economy and sophisticated savings schemes managed in part by the Maple Eight—the country’s eight largest pension funds—is the second largest at $2.35 trillion. The United Kingdom, Luxembourg, Japan, and Switzerland hold a combined $6 trillion.
At $36 trillion in aggregate, foreigners are an important support to US markets, funding American corporates through equity and credit markets and funding the US government through Treasury purchases. The collective portfolio decisions of foreign investors also drive the US dollar. For large capital pools, FX hedging decisions are difficult: hedging costs can be expensive and the dollar has tended to rally during crises, providing a natural tailwind to unhedged foreign portfolios. In a world where US exceptionalism weakens, unhedged investors take losses on both their holdings and the currency, eroding total returns for those with non-dollar-denominated liabilities. The Strait of Hormuz disruption has reinforced the dollar’s safe-haven bid. But each successive wobble—tariffs in April, Greenland in January, and now a military conflict initiated by the United States itself—chips away at that credibility. Investors notice.
Where America Invests
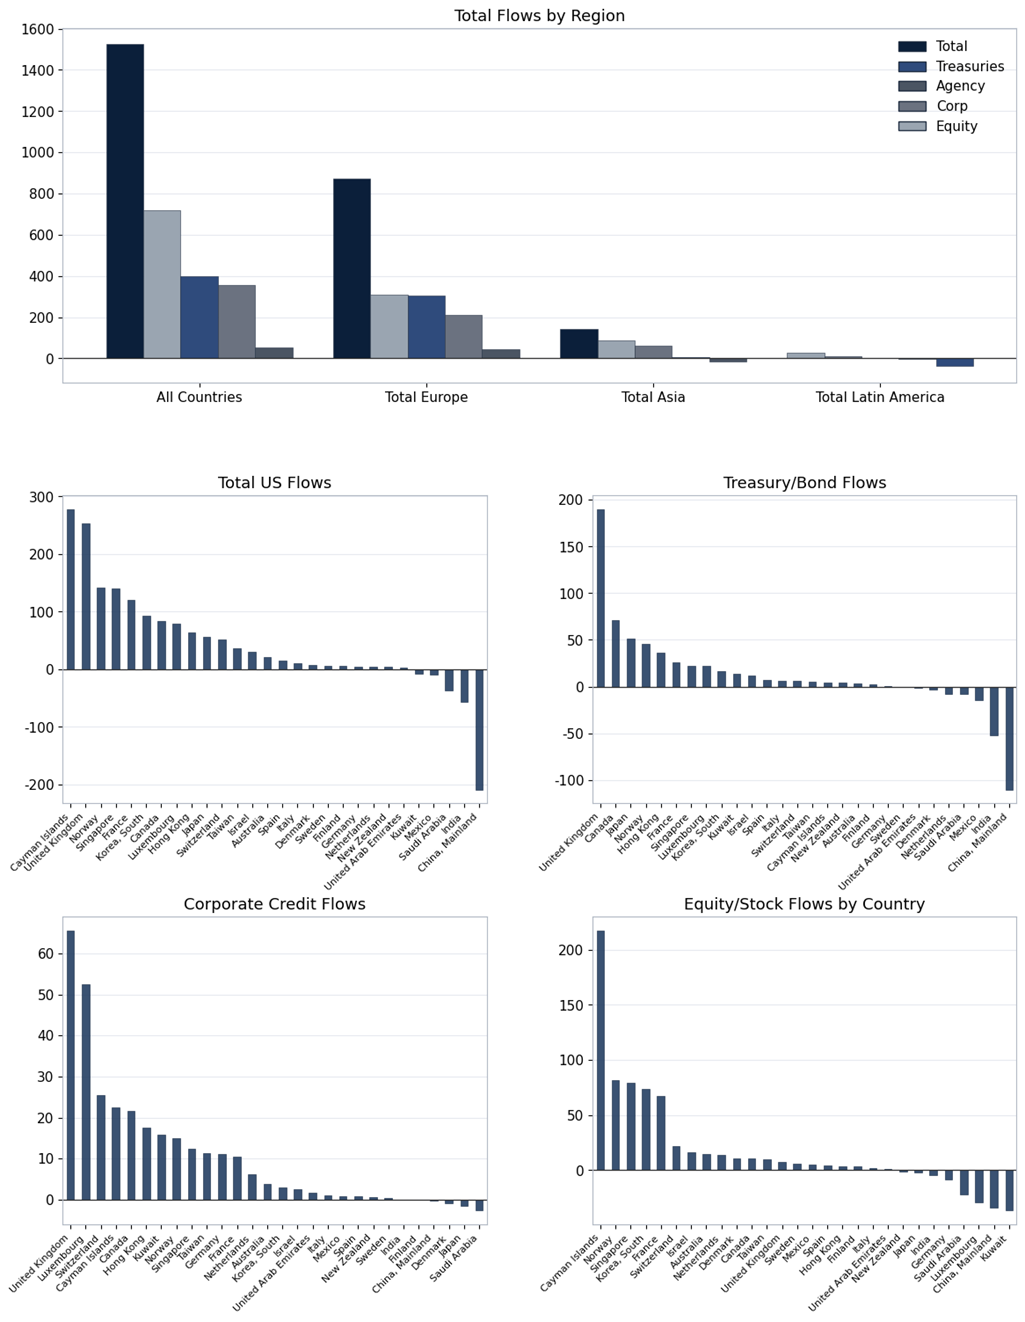
In aggregate, US-domiciled investors hold $18.6 trillion in foreign assets, roughly half of foreign holdings of US assets. This gap reflects a persistent home bias given the liquidity and performance of domestic markets.
In the 1960s, France’s finance minister Valéry Giscard d’Estaing coined the term ‘exorbitant privilege’ to describe the advantage conferred by the dollar as the world’s reserve currency. The privilege shows up as lower borrowing costs when a currency becomes a popular store of value and medium of exchange capable of attracting large savings and investment flows. The privilege is not free. With reserve status, a country needs to produce financial assets to absorb the world’s savings. The United States has chosen to do so by borrowing from the rest of the world to consume more than it produces, which requires corporate and government borrowing and supports earnings and equities through spending and consumption. Trade-surplus countries including China then recycle dollar earnings back into US assets. The exorbitant privilege depends on trust.
US holdings of foreign government bonds are small, with the largest positions in Japan at $93 billion, France at $62 billion, and the United Kingdom at $57 billion. Developed market sovereign bonds are largely interchangeable from a portfolio perspective; managers allocate across different countries’ yield curves to pick up incremental return.
The United States holds $2.6 trillion in foreign corporate credit, with the largest holdings in Canada at $436 billion and the United Kingdom at $365 billion.
In equities, US-domiciled investors hold $15.1 trillion in foreign stocks, with the largest country holdings in the United Kingdom, Japan, Canada, and Switzerland.
An important question for 2026 is whether we see a larger rotation by US-domiciled investors into rest-of-world assets. The Treasury data updates with a lag, but contemporaneous flow data for country ETFs and continued dollar weakness show evidence of rotation to start the year, likely from both foreign and US-based investors. Foreign equities offer more attractive multiples, less concentration in technology, and, for unhedged investors, a tailwind from a weakening dollar. But the Strait of Hormuz disruption has paused this rotation as energy-importing regions reprice. Should energy flows normalize, expect the rotation to resume.
Following the Flows: Foreign Capital into the US
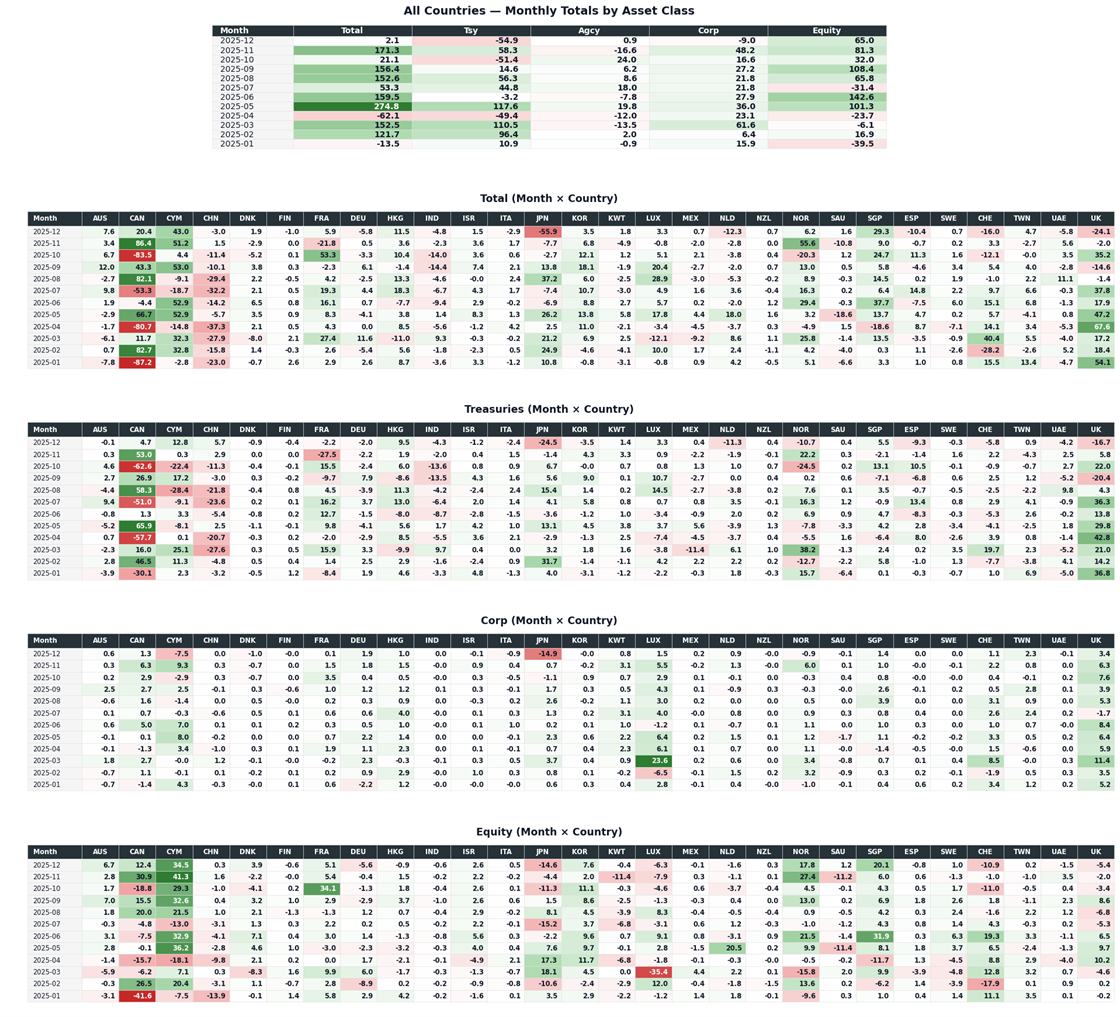
Figure 3 shows foreign flows into US assets for 2025. Figure 4 shows flows by month over the same period.
In aggregate, foreigners purchased $1.5 trillion in US assets in 2025, with $717 billion flowing into equities. Foreign investors were net sellers of US assets in April, triggered by Liberation Day and higher tariffs. The selling was concentrated in Treasuries, with net sales of $59 billion. To put this in context, the US government is running $2 trillion deficits and paying over $2 billion per day in interest. Canada and China were the largest sellers as yields rose, though part of China’s sales may reflect custodial changes to minimize disclosure and the TIC flow data is subject to the same Cayman attribution issues discussed above. The United Kingdom was the largest buyer of both Treasuries and corporate credit over the year, taking advantage of wider credit spreads and higher Treasury yields.
Net equity sales in April 2025 were $17 billion. Monthly data can obscure investors who bought the intra-month dip. The President walked back the tariffs before month end, which proved to be the low in equities for 2025; markets subsequently delivered strong returns from that point. Middle Eastern and Chinese investors were net sellers of US equities over the year, while South Korea, Norway, France, Singapore, and Switzerland were net buyers.
South Korea is worth highlighting for how quickly flows can reverse. The country has an active, technologically savvy retail investor base whose inflows into US equities accounted for 10% of total foreign flows in 2025. Meanwhile, the KOSPI 200 was up 90% in 2025 and is up 45% YTD2 in 2026, as SK Hynix and Samsung—roughly 47% of the index—benefit from dominant positions in chips and memory amid the AI buildout. This flow could reverse in 2026 as local investors repatriate capital into domestic equities. These rallies in foreign equities can be powerful—non-US indices have significantly less liquidity than their US counterparts.
Following the Flows: US Capital Abroad
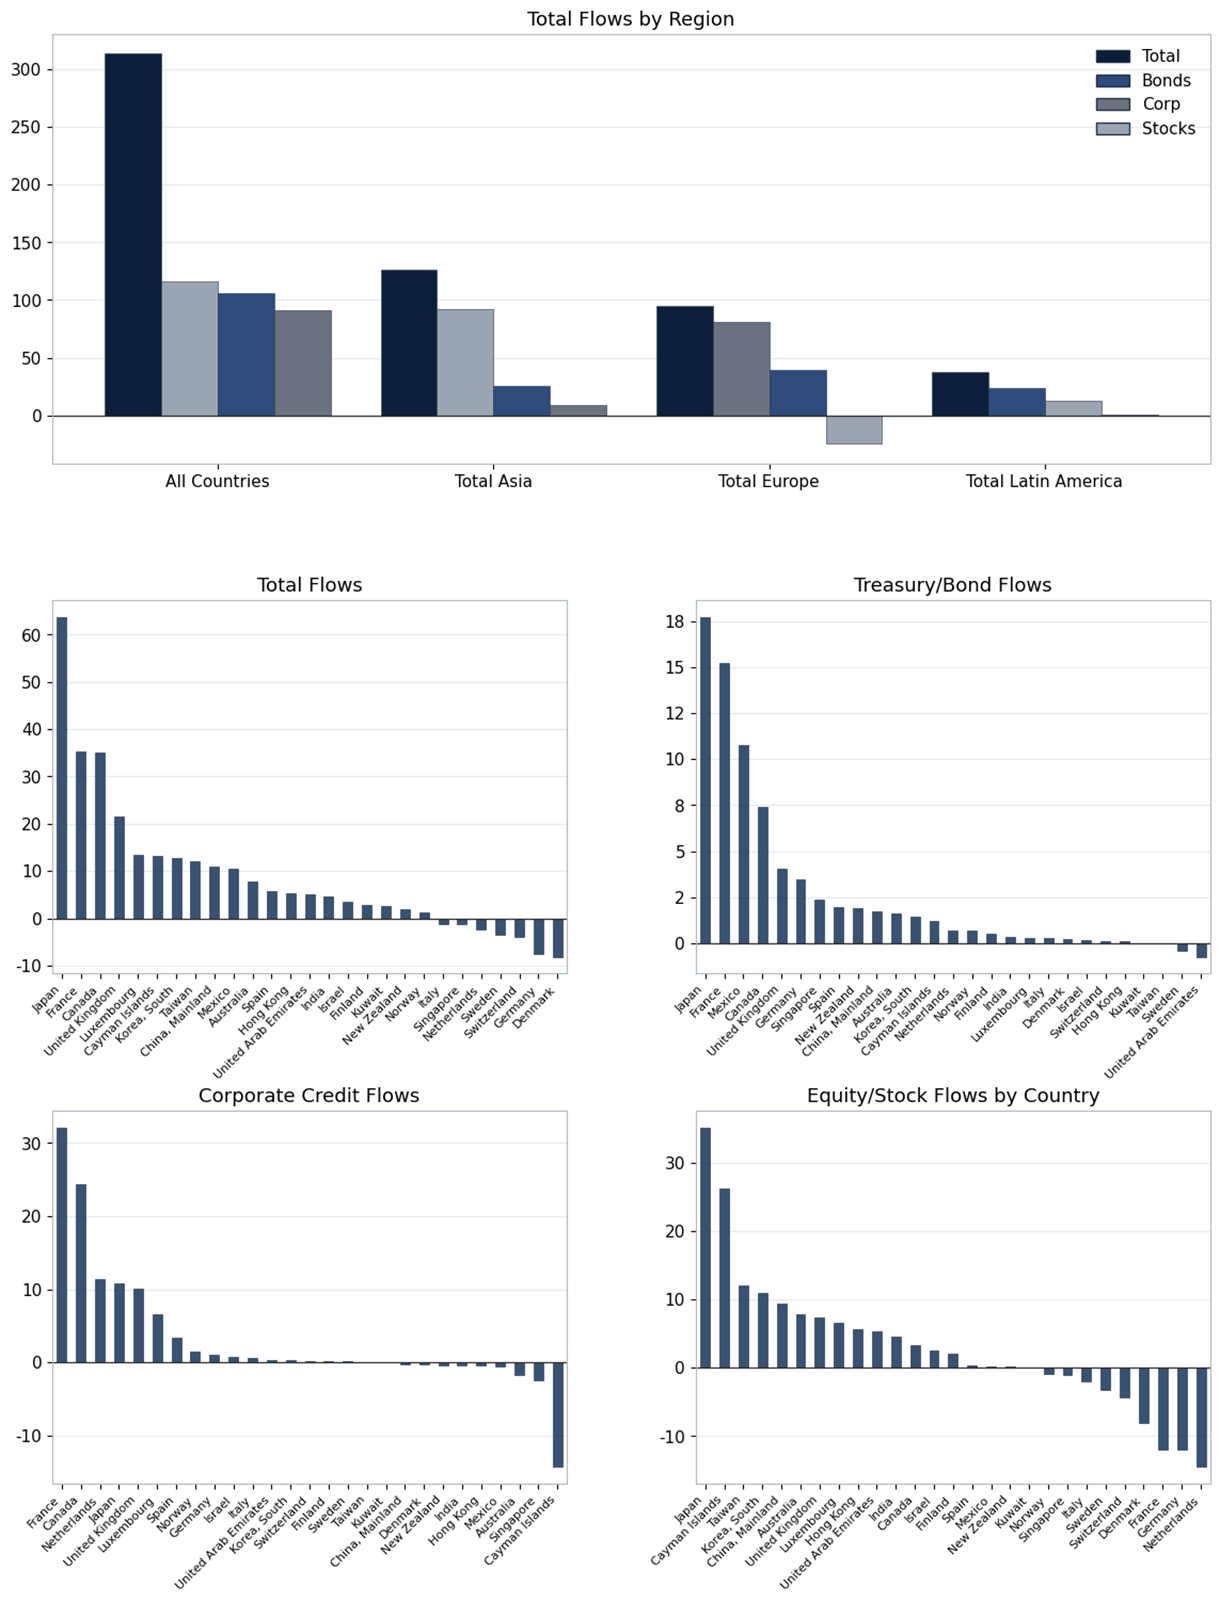
Figure 5 shows US investment into foreign securities. The aggregate amount is small at $313.6 billion, a reflection of the home bias toward US assets.
US investors purchased Japanese and French government bonds, French and Canadian corporate bonds, and Japanese and United Kingdom equities. Japan offered compelling catalysts with the election of Sanae Takaichi and the resurrection of Abenomics, combining tax cuts, fiscal spending, and deregulation. Japanese equities benefited, while bonds and the yen sold off. But the flow figures are small: US investors increased purchases of Japanese bonds by $17.7 billion and Japanese equities by $35.2 billion.
Whether these modest outflows mark the beginning of a broader reallocation toward rest-of-world assets is a key question for 2026. The energy shock has temporarily clouded the picture, but should it resolve, the structural drivers—more attractive valuations abroad, US equity concentration risk, a weakening dollar, and growing discomfort with US policy unpredictability—remain intact.
Key Takeaways
- Foreigners hold $36 trillion in US assets, including $22 trillion in equities. These are record levels built on deep, liquid markets, a favorable regulatory environment, and the world’s most profitable companies. But record positioning means the bar for continued inflows is high.
- The TIC data understates the role of hedge funds. Holdings attributed to the Cayman Islands reflect legal domicile, not domestic savings. Fed research suggests hedge funds are likely the largest holders of US Treasuries when accounting for positions held through prime brokers and repo chains. A meaningful share of Treasury demand comes from leveraged, return-sensitive capital rather than long-term holders.
- Before the Middle East escalation, evidence pointed to a rotation out of US assets at the margin—visible in ETF flows, dollar weakness, and foreign equity outperformance in late 2025 and early 2026. The drivers were stretched US valuations, concentration in a handful of technology names, a weakening dollar, and growing concerns around US policy predictability.
- The Strait of Hormuz disruption has paused that rotation. Energy-importing regions in Europe and Asia are repricing growth expectations, and the dollar has firmed on safe-haven demand. The United States, as a net energy producer, is relatively insulated.
- Geopolitical outcomes are inherently uncertain. Should the Strait reopen and energy flows normalize, the pre-conflict dynamics—valuation differentials, concentration risk, dollar weakness—reassert themselves and the structural rotation resumes.
1 https://www.federalreserve.gov/econres/notes/feds-notes/the-cross-border-trail-of-the-treasury-basis-trade-20251015.html
2 As of April 10th, 2026
Disclaimer:
Any statements regarding market events, future events or other similar statements constitute only subjective views, are based upon expectations or beliefs, involve inherent risks and uncertainties and should therefore not be relied on. Future evidence and actual results could differ materially from those set forth, contemplated by or underlying these statements. In light of these risks and uncertainties, there can be no assurance that these statements are or will prove to be accurate or complete in any way. All opinions and estimates included in this document constitute judgments of CFM as at the date of this document and are subject to change without notice. CFM accepts no liability for any inaccurate, incomplete or omitted information of any kind or any losses caused by using this information. CFM does not give any representation or warranty as to the reliability or accuracy of the information contained in this document. The information provided in this document is general information only and does not constitute investment or other advice. The content of this document does not constitute an offer or solicitation to subscribe for any security or interest.