2026 Midterms: What’s Old in Washington
The most likely result of the 2026 midterms is a Congress split down the middle: Democrats reclaiming the House, Republicans narrowly holding the Senate. This seems to be the current and widely reported narrative.
How we get there is a story of two very different contests, and the difference comes down to what a poll can and can’t tell you. In the Senate, every race is statewide: there is nothing between the voter and the outcome, so a poll is a clean reading of public opinion In the House, many districts were redrawn over the past year by politicians with a stake in the outcome, so a poll there measures something more tangled.
Modeling the mechanics of the Senate
Most Senate seats on the ballot aren’t truly in doubt. Set those aside and, by a generous count, we’re left with nine genuinely competitive races. Democrats hold 47 seats and need 51 for a majority (since the Vice President is Republican, a 50–50 split does them no good). To win control, they’d have to nearly sweep the toss-ups: roughly 7 of the 9. That’s an extraordinarily high bar.
We have built a deliberately bare-bones model to predict the Democratic vote share in every Senate race back to 2000. It leans on a handful of things knowable before the campaigning starts: how the state votes for president, the best gauge of its partisan lean, which does most of the work; the national mood, measured by presidential approval, on the well-worn principle that an unpopular president drags his party down; and whether a sitting senator is on the ballot, which matters unusually this year, since four of the nine competitive seats are open and hand nobody that advantage. On top of those we add state polling, but the fundamentals carry most of the weight by pinning down the likely result in most races before a single poll is taken.
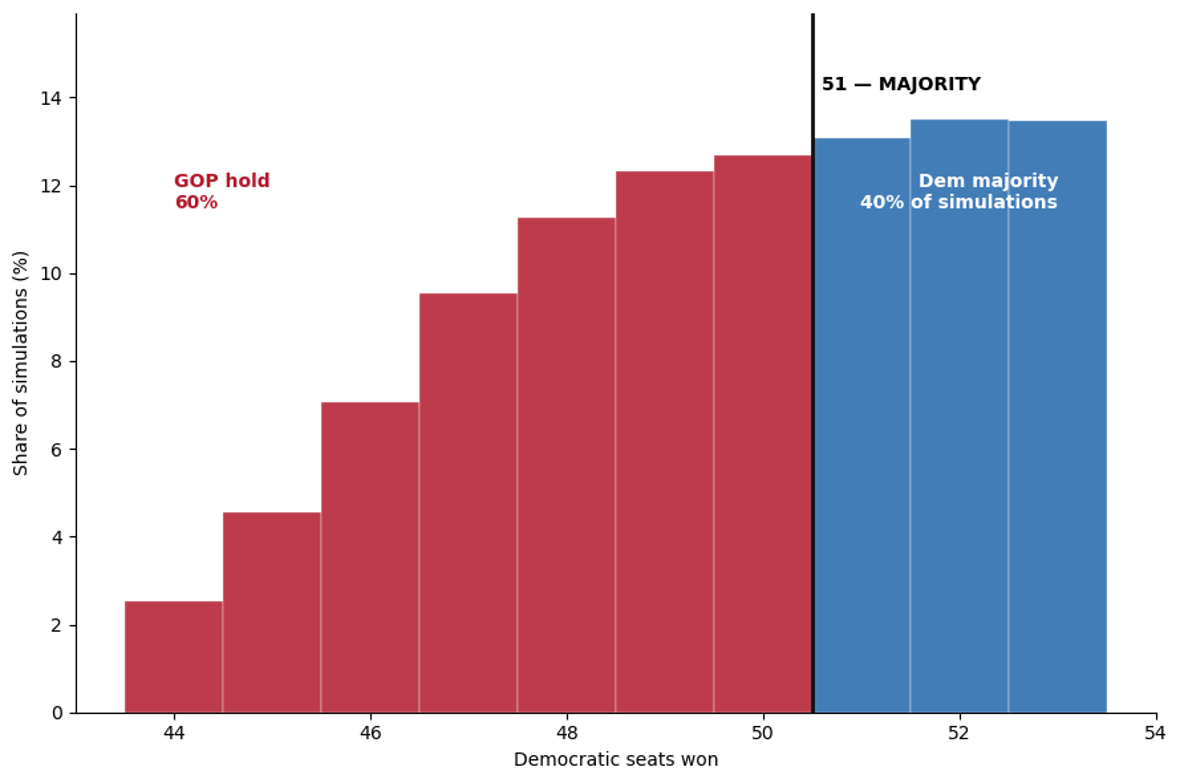
We then simulated the entire Senate election 50,000 times. On each run, we let the national environment break a bit better or worse for Democrats than expected, letting each race wobble with its own local luck, and tallied the seats. Each bar below shows how often Democrats ended up with a given number of seats. The vertical line marks the 51 needed for a majority; everything to its left is a Republican Senate, everything to its right a Democratic one.
Forecasts come from a state-level Ordinary Least Squares (OLS) model. The dependent variable is the Democratic two-party Senate vote share, and the variables used for prediction are the state’s presidential baseline, the presidential swing since the prior cycle, the national environment (measured from presidential-approval polling), an incumbency indicator (+1 Democrat, −1 Republican, 0 open), and a state polling signal. It is trained on Senate elections from 2000 forward. Uncertainty is built empirically: we re-estimate the model on thousands of resampled datasets to capture how much its coefficients could plausibly differ, then add two shocks to each simulated election — one national swing shared across every state, and one idiosyncratic shock unique to each race — with both sized from the model’s own historical misses rather than any assumed bell curve.
The model calls the winning party correctly in the backtest of competitive seats about 84% of the time: no better than simple rules like “the incumbent wins” or “the seat follows the state’s presidential lean.” That it can’t beat them is the point: a Senate map is mostly decided before the campaign begins.
We simulate only the nine competitive seats and assign every other seat to the party that holds it, so the distribution is lopsided rather than bell-shaped. Simulating all 34 seats on the ballot smooths the shape and raises the Democratic chance from 40% to 46%, because letting more seats vary widens the range of outcomes and pulls the odds toward a coin flip. Even so, Republicans remain favored to hold the chamber.
Source: MIT Election Lab, FEC, Gallup/AP-NORC/CNN-SSRS/Ipsos/Marist/YouGov/Pew/Reuters approval polling, FiveThirtyEight Senate polls, CFM
In our simulations, situations where Democrats grab the majority (the blue bars in the chart) show up in about four out of every ten runs. The rest of the time, Republicans hold the chamber. It’s tempting to just report a “40% chance” and call it a day, but we can’t responsibly be that precise. That figure depends a lot on how correlated the surprises are across different states, which is something we can’t pin down with certainty.
If the polls are off in the same direction everywhere (as they famously were in 2016 and 2020), then a good night for Democrats could turn into a great night. In that scenario, the odds of taking the Senate climb toward 45% (nearly one in two). On the other hand, if each race behaves independently, the chance of a Democratic sweep sinks toward 20% (one in five), because winning 7 out of 9 separate contests is then a very tall order. The honest answer is that the probability of Democrats gaining a Senate majority lies somewhere between 20% and 45%. It hinges on an imponderable: whether the polling errors this year will all tilt the same way or average each other out.
So, with the national winds at their backs, why are Democrats still stuck? Because none of it is enough to beat the map. The environment clearly tilts their way and yet they still fall short.
Here’s where it gets interesting. Because Democrats have to win so many seats, no single victory tells the whole story, but some tell far more than others. Let’s divide the 50,000 runs by who won a given state and then ask how often Democrats take the majority in each scenario.
The most revealing seats turn out to be the ones Democrats are least likely to win. When they take Ohio, they end up with a majority 74% of the time; when they lose it, only 12%. Alaska behaves the same way. Neither is a state Democrats expect to win, which is exactly why a win there screams that the national mood has broken hard in their direction, and if it’s broken that hard, they’ve swept the easier races too. These are the barometer seats: they rarely turn blue, but when they do, the mood has swung everywhere.
The genuinely pivotal race, though, is one Democrats already hold: Michigan, now open after a retirement. Winning it barely helps, since they’re supposed to. But losing it is close to fatal: in the runs where Republicans flip Michigan, Democrats reach a majority only about 5% of the time. The clearest read, though, comes by looking at pairs. If Democrats win both North Carolina and Maine, the two likeliest flips, they become 63% favorites for the chamber; if they win North Carolina but drop Maine, that collapses to 7%. Maine, thus, becomes a critical state for taking the Senate.
In short, the Democratic path is narrow and unforgiving. They must hold Michigan without fail, win both North Carolina and Maine, and then pull at least one more seat out of areas that Trump carried comfortably.
Modeling the (ever-changing) quirks of the House
If the Senate is settled largely by structure, the House is settled by something much less stable: who controls the pen.1 Based on the raw math, it looks far kinder to Democrats. Democrats hold 214 House seats and need 218, a gain of just a small handful. Against the Senate’s near sweep of nine toss-ups, that is a gentle climb. Unlike the Senate’s scattered handful, the House offers dozens of districts on a knife edge, any of which could tip.
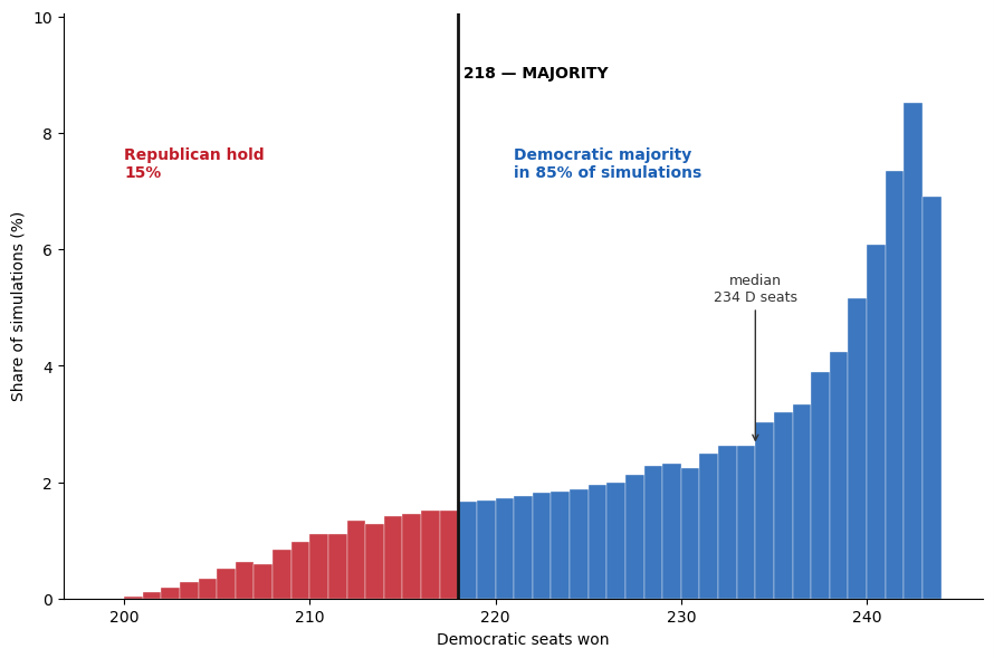
Our House model works a little differently: the chamber has its own quirks, and with hundreds of races to learn from, there’s enough data to lean on a few more signals reliably, but the idea is the same: we estimate the likely Democratic vote share in every competitive district, then simulate the chamber 50,000 times. The vertical line marks the 218 seats needed for control.
Forecasts come from a district-level Ordinary Least Squares (OLS) model estimated on competitive House cycles — districts whose Democratic two-party share in the prior cycle fell between 40% and 60% — trained nationally on elections from 2000 through the cycle before the forecast year. The dependent variable is the Democratic two-party House vote share. The predictors are the district’s own two-party vote share in the prior cycle, the national environment (built from presidential-approval polling averaged from January through mid-September of the election year, signed to the Democratic direction), an incumbency indicator (+1 Democrat, −1 Republican, 0 open) from FEC filings, the Democratic share of combined Democratic-plus-Republican FEC fundraising in the district, the change in gas prices since the prior cycle, and a district polling signal. Congressional map-era and state fixed effects absorb cross-era, cross-state differences in district baselines.
The poll-augmented model’s errors run about 4 points from the actual vote share, and its win/loss calls clearly outperform naive rules such as “the district reelects whoever held the seat last cycle” or “the incumbent party holds” (roughly 70% directional accuracy vs. 56–61% for those rules).
We simulate only the 43 competitive seats and assign every other seat to the party that holds it. Democrats start close to the top of what those seats can deliver, so the simulations pile up against that ceiling and leave a long tail toward Republican outcomes. Simulating more seats gives a more familiar bell shape but barely changes the result: the chance of a Democratic majority is 85% with the 43 competitive seats, 83% with the 144 seats in the 40–60% band, and 86% with the full chamber, because the rare upsets among hundreds of safe seats largely cancel out.
Source: MIT Election Lab, FEC, EIA, Gallup/AP-NORC/CNN-SSRS/Ipsos/Marist/YouGov/Pew/Reuters approval polling, FiveThirtyEight district polls, CFM
Our median estimate is 234 Democratic seats, with a 90% range from 210 to 243: everything from a narrow Republican hold to a decisive Democratic win. On current inputs, Democrats take the House in about 85% of simulations.
The bulk of the distribution sits on the Democratic side. How much would have to go wrong to undo it? Sliding the whole field by a uniform national swing, it takes about a 9-point move against the Democrats to drag the House back to a true coin flip. Their edge is real, and this cycle a deep one.
The big difference between the House and the Senate
There is, though, one issue the fundamentals alone cannot handle: the past year has seen a wave of redistricting that has effectively redrawn the electoral map, with now 10 states where history no longer matches the district on the ballot. Normally, lines are redrawn once a decade, after the census. This past year has seen a partisan, tit-for-tat round of mid-cycle gerrymandering, opened by Texas and followed by others, with a set of Voting Rights Act fights running alongside in the courts. The results broke mostly for Republicans: Texas, Florida, Ohio, North Carolina, Missouri and a few Southern states dismantled Democratic-leaning seats, while California and Utah cut the other way. On balance it shifts approximately five net seats to the GOP, a change the fundamentals cannot see, because they read each district off its last House result, cast on the old lines. Only the polls, which ask voters in the districts as they now exist, can pick it up, and only where they have been fielded.
It’s worth being clear about how that shift is manufactured, because the mechanism is easy to miss: redrawing a map moves seats without moving a single voter. Florida is the cleanest example. Hold every voter exactly where they are, and the state’s district-averaged Democratic share barely moves, from about 44.2% to 44.1%. The same redrawing of district lines, however, sees the number of Democratic-leaning districts falling from eight to four. Texas ran the same play at triple the scale, redrawing 37 of its 38 districts while the statewide share held near 44%; a Houston-area district, a district that had voted better than 70% Democratic, was rebuilt almost from scratch into one that votes 40%, its old voters folded into neighboring seats that were already safe. Nothing about how these states vote changed: only their delegations did.
This engineering is not a Republican invention, and it would be dishonest to present it that way. The tool doesn’t care about party; this cycle Republicans simply had more hands on it. Where Democrats held the pen, they used it the same way: California suspended its own independent commission by ballot measure, specifically to draw roughly five seats back as an answer to Texas, and Utah moved a seat the other way under a court order. The pattern is old, too. In 2012, Democratic House candidates won more than a million more votes nationwide than Republicans and still faced a 234-seat Republican majority, the payoff of the post-2010 redraw. In 2018 the Democratic wave was large enough to swamp the maps anyway, and in 2022 the post-census round netted out close to flat nationally once a Democratic gerrymander struck down by a Democratic court was counted against Republican gains elsewhere. The lever cuts both ways, and the courts are part of the machinery, not bystanders to it.
Thus the fundamentals, reading each district off its own past, describe the old map, and this is exactly where the polls earn their place: they are the only direct measure of how voters on the new lines intend to vote. On the fundamentals alone, Democrats take the House in 89% of simulations; feed in the polling fielded on the new lines and that slips to 85%, with the Republican-hold chance rising from 11% to 15%. Part of those four points is likely the price of this cycle’s redraw, though the polls carry other news too, and we cannot cleanly separate the two. The correction is also incomplete: polls reach only the contested districts where they exist, and seats outside our competitive list are assigned to the party that holds them today, even where the new lines have changed the odds. Still, notice the direction of the fight. In the Senate, a favorable public mood ran into the map and lost; here the map runs into a favorable public mood and, on our numbers, loses. The gerrymander is real, it is only partly priced in, and on current evidence it trims the Democratic margin rather than erasing it.
Therefore, the likeliest 2026 election outcome is a divided Congress, though the split itself is the least interesting thing here. The Senate can mostly be reasoned out in advance, because its structure is fixed. The House cannot be treated in the same way, with a big part of its structure redrawn over the past year by the people on the ballot. In summary, for these midterms, it is difficult to separate two forces at work: the voters’ decision, and what has been decided for them.
1 The political party that controls the state legislature is said to hold the (redistricting) pen.
Disclaimer:
Any statements regarding market events, future events or other similar statements constitute only subjective views, are based upon expectations or beliefs, involve inherent risks and uncertainties and should therefore not be relied on. Future evidence and actual results could differ materially from those set forth, contemplated by or underlying these statements. In light of these risks and uncertainties, there can be no assurance that these statements are or will prove to be accurate or complete in any way. All opinions and estimates included in this document constitute judgments of CFM as at the date of this document and are subject to change without notice. CFM accepts no liability for any inaccurate, incomplete or omitted information of any kind or any losses caused by using this information. CFM does not give any representation or warranty as to the reliability or accuracy of the information contained in this document. The information provided in this document is general information only and does not constitute investment or other advice. The content of this document does not constitute an offer or solicitation to subscribe for any security or interest.